Sony 2015 Annual Report Download - page 52
Download and view the complete annual report
Please find page 52 of the 2015 Sony annual report below. You can navigate through the pages in the report by either clicking on the pages listed below, or by using the keyword search tool below to find specific information within the annual report.-
 1
1 -
2
-
3
-
4
-
5
-
6
-
7
-
8
-
9
-
10
-
11
-
12
-
13
-
14
-
15
-
16
-
17
-
18
-
19
-
20
-
21
-
22
-
23
-
24
-
25
-
26
-
27
-
28
-
29
-
30
-
31
-
32
-
33
-
34
-
35
-
36
-
37
-
38
-
39
-
40
-
41
-
 42
42 -
 43
43 -
 44
44 -
 45
45 -
 46
46 -
 47
47 -
 48
48 -
 49
49 -
 50
50 -
 51
51 -
 52
52 -
 53
53 -
 54
54 -
 55
55 -
 56
56 -
 57
57 -
 58
58 -
 59
59 -
 60
60 -
 61
61 -
 62
62 -
63
-
64
-
65
-
66
-
67
-
68
-
69
-
70
-
71
-
72
-
73
-
74
-
75
-
76
-
77
-
78
-
79
-
80
-
81
-
82
-
83
-
84
-
85
-
86
-
87
-
88
-
89
-
90
-
91
-
92
-
93
-
94
-
95
-
96
-
97
-
98
-
99
-
100
-
101
-
102
-
103
-
104
-
105
-
106
-
107
-
108
-
109
-
110
-
111
-
112
-
113
-
114
-
115
-
116
-
117
-
118
-
119
-
120
-
121
-
122
-
123
-
124
-
125
-
126
-
127
-
128
-
129
-
130
-
131
-
132
-
133
-
134
-
135
-
136
-
137
-
138
-
139
-
140
-
141
-
142
-
143
-
144
-
145
-
146
-
147
-
148
-
149
-
150
-
151
-
152
-
153
-
154
-
155
-
156
-
157
-
158
-
159
-
160
-
161
-
162
-
163
-
164
-
165
-
166
-
167
-
168
-
169
-
170
-
171
-
172
-
173
-
174
-
175
-
176
-
177
-
178
-
179
-
180
-
181
-
182
-
183
-
184
-
185
-
186
-
187
-
188
-
189
-
190
-
191
-
192
-
193
-
194
-
195
-
196
-
197
-
198
-
199
-
200
-
201
-
202
-
203
-
204
-
205
-
206
-
207
-
208
-
209
-
210
-
211
-
212
-
213
-
214
-
215
-
216
-
217
-
218
-
219
-
220
-
221
-
222
-
223
-
224
-
225
-
226
-
227
-
228
-
229
-
230
-
231
-
232
 |
 |

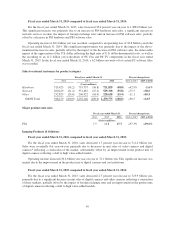
of the camera module business, including the recording of a 59.6 billion yen impairment charge related to long-
lived assets, the deterioration in the operating results of the battery business, including the recording of a
30.6 billion yen impairment charge related to long-lived assets, increases in depreciation and amortization
expenses as well as an increase in research and development expenses. This deterioration was partially offset by
the positive impact of foreign exchange rates. For the camera module business, due to a decrease in projected
future demand, Sony revised its Mid-Range Plan for the period beginning with the fiscal year ending March 31,
2017. Given the decrease in projected future demand, Sony performed an impairment analysis in the quarter
ended March 31, 2016, and determined that future cash flows would not be sufficient to recover the entire
carrying amount of the long-lived assets, resulting in the impairment charge. For the battery business, due to the
increasingly competitive markets, Sony performed an impairment analysis in the quarter ended December 31,
2015, and reduced the corresponding estimated future cash flows and the estimated ability to recover the entire
carrying amount of the long-lived assets, resulting in the impairment charge.
Fiscal year ended March 31, 2015 compared to fiscal year ended March 31, 2014:
For the fiscal year ended March 31, 2015, sales increased 25.0 percent year-on-year to 927.1 billion yen.
This increase was primarily due to a significant increase in sales of image sensors reflecting higher demand for
mobile products, the impact of foreign exchange rates, as well as a significant increase in sales of camera
modules. Sales to external customers increased 31.4 percent year-on-year.
Operating income of 89.0 billion yen was recorded, compared to an operating loss of 16.9 billion yen in the
fiscal year ended March 31, 2014. This significant improvement was primarily due to the impact of the above-
mentioned increase in sales of image sensors, the recording of a 32.1 billion yen impairment charge related to
long-lived assets in the battery business in the fiscal year ended March 31, 2014 and the favorable impact of
foreign exchange rates.
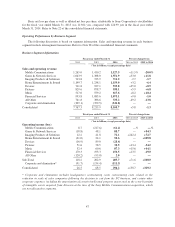
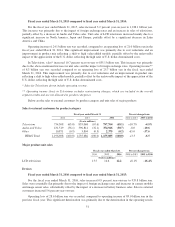
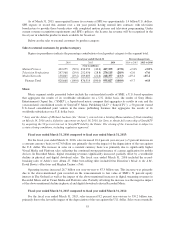
Below are the sales to external customers by product category:
Sales to external customers by product category
Figures in parentheses indicate the percentage contribution of each product category to the segment total.
Fiscal year ended March 31 Percent change from
2014 2015 2016 2014 to 2015 2015 to 2016
(Yen in millions)
Semiconductors 342,072 (61.9) 501,015 (69.0) 558,983 (72.9) +46.5% +11.6%
Components 207,833 (37.6) 217,935 (30.0) 197,316 (25.7) +4.9 -9.5
Other 2,493 (0.5) 7,010 (1.0) 10,458 (1.4) +181.2 +49.2
Devices Total 552,398 (100.0) 725,960 (100.0) 766,757 (100.0) +31.4 +5.6
Electronics*
* The term “Electronics” refers to the sum of the MC, G&NS, IP&S, HE&S and Devices segments.
Inventory
Total inventory of the Electronics segments above as of March 31, 2016 was 599.9 billion yen, an increase
of 36.5 billion yen, or 6.5 percent compared with the level as of March 31, 2015. Total inventory of the
Electronics segments above as of March 31, 2015 was 563.4 billion yen, a decrease of 56.4 billion yen, or
9.1 percent, compared with the level as of March 31, 2014.
52