Sony 2015 Annual Report Download - page 121
Download and view the complete annual report
Please find page 121 of the 2015 Sony annual report below. You can navigate through the pages in the report by either clicking on the pages listed below, or by using the keyword search tool below to find specific information within the annual report.-
 1
1 -
2
-
3
-
4
-
5
-
6
-
7
-
8
-
9
-
10
-
11
-
12
-
13
-
14
-
15
-
16
-
17
-
18
-
19
-
20
-
21
-
22
-
23
-
24
-
25
-
26
-
27
-
28
-
29
-
30
-
31
-
32
-
33
-
34
-
35
-
36
-
37
-
38
-
39
-
40
-
41
-
42
-
43
-
44
-
45
-
46
-
47
-
48
-
49
-
50
-
51
-
52
-
53
-
54
-
55
-
56
-
57
-
58
-
59
-
60
-
61
-
62
-
63
-
64
-
65
-
66
-
67
-
68
-
69
-
70
-
71
-
72
-
73
-
74
-
75
-
76
-
77
-
78
-
79
-
80
-
81
-
82
-
83
-
84
-
85
-
86
-
87
-
88
-
89
-
90
-
91
-
92
-
93
-
94
-
95
-
96
-
97
-
98
-
99
-
100
-
101
-
102
-
103
-
104
-
105
-
106
-
107
-
108
-
109
-
110
-
 111
111 -
 112
112 -
 113
113 -
 114
114 -
 115
115 -
 116
116 -
 117
117 -
 118
118 -
 119
119 -
 120
120 -
 121
121 -
 122
122 -
 123
123 -
 124
124 -
 125
125 -
 126
126 -
 127
127 -
 128
128 -
 129
129 -
 130
130 -
 131
131 -
132
-
133
-
134
-
135
-
136
-
137
-
138
-
139
-
140
-
141
-
142
-
143
-
144
-
145
-
146
-
147
-
148
-
149
-
150
-
151
-
152
-
153
-
154
-
155
-
156
-
157
-
158
-
159
-
160
-
161
-
162
-
163
-
164
-
165
-
166
-
167
-
168
-
169
-
170
-
171
-
172
-
173
-
174
-
175
-
176
-
177
-
178
-
179
-
180
-
181
-
182
-
183
-
184
-
185
-
186
-
187
-
188
-
189
-
190
-
191
-
192
-
193
-
194
-
195
-
196
-
197
-
198
-
199
-
200
-
201
-
202
-
203
-
204
-
205
-
206
-
207
-
208
-
209
-
210
-
211
-
212
-
213
-
214
-
215
-
216
-
217
-
218
-
219
-
220
-
221
-
222
-
223
-
224
-
225
-
226
-
227
-
228
-
229
-
230
-
231
-
232
 |
 |

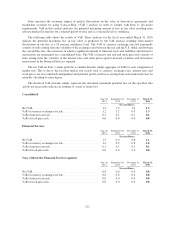
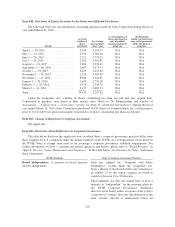
Sony measures the economic impact of market fluctuations on the value of derivatives agreements and
marketable securities by using Value-at-Risk (“VaR”) analysis in order to comply with Item 11 disclosure
requirements. VaR in this context indicates the potential maximum amount of loss in fair value resulting from
adverse market fluctuations for a selected period of time and at a selected level of confidence.
The following table shows the results of VaR. These analyses for the fiscal year ended March 31, 2016
indicate the potential maximum loss in fair value as predicted by the VaR analysis resulting from market
fluctuations in one day at a 95 percent confidence level. The VaR of currency exchange rate risk principally
consists of risks arising from the volatility of the exchange rates between the yen and the U.S. dollar and between
the yen and the euro, the currencies in which a significant amount of financial assets and liabilities and derivative
transactions are maintained on a consolidated basis. The VaR of interest rate risk and stock price risk consists of
risks arising from the volatility of the interest rates and stock prices against invested securities and derivatives
transactions in the Financial Services segment.
The net VaR for Sony’s entire portfolio is smaller than the simple aggregate of VaR for each component of
market risk. This is due to the fact that market risk factors such as currency exchange rates, interest rates and
stock prices are not completely independent and potential profits and losses arising from each market risk may be
mutually offsetting to some degree.
The disclosed VaR amounts simply represent the calculated maximum potential loss on the specified date
and do not necessarily indicate an estimate of actual or future loss.
Consolidated
June 30,
2015
September 30,
2015
December 31,
2015
March 31,
2016
(Yen in billions)
NetVaR ............................................. 1.2 1.2 1.0 1.3
VaR of currency exchange rate risk ........................ 1.2 1.2 0.9 1.3
VaR of interest rate risk ................................. 0.1 0.1 0.1 0.1
VaR of stock price risk .................................. 0.0 0.0 0.0 0.0
Financial Services
June 30,
2015
September 30,
2015
December 31,
2015
March 31,
2016
(Yen in billions)
NetVaR ............................................. 1.3 0.9 0.8 1.1
VaR of currency exchange rate risk ........................ 1.2 0.9 0.8 1.0
VaR of interest rate risk ................................. 0.1 0.1 0.1 0.1
VaR of stock price risk .................................. 0.0 0.0 0.0 0.0
Sony without the Financial Services segment
June 30,
2015
September 30,
2015
December 31,
2015
March 31,
2016
(Yen in billions)
NetVaR ............................................. 0.8 0.6 0.4 0.8
VaR of currency exchange rate risk ........................ 0.8 0.6 0.4 0.8
VaR of interest rate risk ................................. 0.0 0.0 0.0 0.0
VaR of stock price risk .................................. 0.0 0.0 0.0 0.0
121