Sony 2015 Annual Report Download - page 72
Download and view the complete annual report
Please find page 72 of the 2015 Sony annual report below. You can navigate through the pages in the report by either clicking on the pages listed below, or by using the keyword search tool below to find specific information within the annual report.-
 1
1 -
2
-
3
-
4
-
5
-
6
-
7
-
8
-
9
-
10
-
11
-
12
-
13
-
14
-
15
-
16
-
17
-
18
-
19
-
20
-
21
-
22
-
23
-
24
-
25
-
26
-
27
-
28
-
29
-
30
-
31
-
32
-
33
-
34
-
35
-
36
-
37
-
38
-
39
-
40
-
41
-
42
-
43
-
44
-
45
-
46
-
47
-
48
-
49
-
50
-
51
-
52
-
53
-
54
-
55
-
56
-
57
-
58
-
59
-
60
-
61
-
 62
62 -
 63
63 -
 64
64 -
 65
65 -
 66
66 -
 67
67 -
 68
68 -
 69
69 -
 70
70 -
 71
71 -
 72
72 -
 73
73 -
 74
74 -
 75
75 -
 76
76 -
 77
77 -
 78
78 -
 79
79 -
 80
80 -
 81
81 -
 82
82 -
83
-
84
-
85
-
86
-
87
-
88
-
89
-
90
-
91
-
92
-
93
-
94
-
95
-
96
-
97
-
98
-
99
-
100
-
101
-
102
-
103
-
104
-
105
-
106
-
107
-
108
-
109
-
110
-
111
-
112
-
113
-
114
-
115
-
116
-
117
-
118
-
119
-
120
-
121
-
122
-
123
-
124
-
125
-
126
-
127
-
128
-
129
-
130
-
131
-
132
-
133
-
134
-
135
-
136
-
137
-
138
-
139
-
140
-
141
-
142
-
143
-
144
-
145
-
146
-
147
-
148
-
149
-
150
-
151
-
152
-
153
-
154
-
155
-
156
-
157
-
158
-
159
-
160
-
161
-
162
-
163
-
164
-
165
-
166
-
167
-
168
-
169
-
170
-
171
-
172
-
173
-
174
-
175
-
176
-
177
-
178
-
179
-
180
-
181
-
182
-
183
-
184
-
185
-
186
-
187
-
188
-
189
-
190
-
191
-
192
-
193
-
194
-
195
-
196
-
197
-
198
-
199
-
200
-
201
-
202
-
203
-
204
-
205
-
206
-
207
-
208
-
209
-
210
-
211
-
212
-
213
-
214
-
215
-
216
-
217
-
218
-
219
-
220
-
221
-
222
-
223
-
224
-
225
-
226
-
227
-
228
-
229
-
230
-
231
-
232
 |
 |

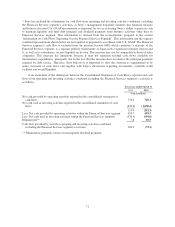
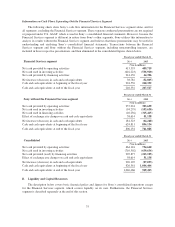
Information on Cash Flows Separating Out the Financial Services Segment
The following charts show Sony’s cash flow information for the Financial Services segment alone, and for
all segments, excluding the Financial Services segment. These separate condensed presentations are not required
or prepared under U.S. GAAP, which is used in Sony’s consolidated financial statements. However, because the
Financial Services segment is different in nature from Sony’s other segments, Sony utilizes this information to
analyze its results without the Financial Services segment and believes that these presentations may be useful in
understanding and analyzing Sony’s consolidated financial statements. Transactions between the Financial
Services segment and Sony without the Financial Services segment, including noncontrolling interests, are
included in those respective presentations, and then eliminated in the consolidated figures shown below.
Fiscal year ended March 31
Financial Services segment 2015 2016
(Yen in millions)
Net cash provided by operating activities 459,719 495,283
Net cash used in investing activities (536,920) (694,031)
Net cash provided by financing activities 44,396 224,922
Net increase (decrease) in cash and cash equivalents (32,805) 26,174
Cash and cash equivalents at beginning of the fiscal year 240,332 207,527
Cash and cash equivalents at end of the fiscal year 207,527 233,701
Fiscal year ended March 31
Sony without the Financial Services segment 2015 2016
(Yen in millions)
Net cash provided by operating activities 303,659 262,783
Net cash used in investing activities (103,630) (334,900)
Net cash provided by (used in) financing activities (315,415) 144,751
Effect of exchange rate changes on cash and cash equivalents 51,138 (64,609)
Net increase (decrease) in cash and cash equivalents (64,248) 8,025
Cash and cash equivalents at beginning of the fiscal year 806,134 741,886
Cash and cash equivalents at end of the fiscal year 741,886 749,911
Fiscal year ended March 31
Consolidated 2015 2016
(Yen in millions)
Net cash provided by operating activities 754,640 749,089
Net cash used in investing activities (639,636) (1,030,403)
Net cash provided by (used in) financing activities (263,195) 380,122
Effect of exchange rate changes on cash and cash equivalents 51,138 (64,609)
Net increase (decrease) in cash and cash equivalents (97,053) 34,199
Cash and cash equivalents at beginning of the fiscal year 1,046,466 949,413
Cash and cash equivalents at end of the fiscal year 949,413 983,612
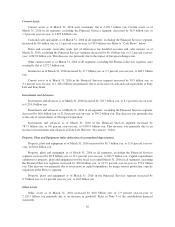
Cash Flows
(The fiscal year ended March 31, 2015 compared with the fiscal year ended March 31, 2014)
Operating Activities: During the fiscal year ended March 31, 2015, there was a net cash inflow of
754.6 billion yen from operating activities, an increase of 90.5 billion yen, or 13.6 percent year-on-year.
For all segments excluding the Financial Services segment, there was a net cash inflow of 303.7 billion yen,
an increase of 46.4 billion yen, or 18.1 percent year-on-year. The net cash inflow was primarily due to the
72