Sony 2015 Annual Report Download - page 60
Download and view the complete annual report
Please find page 60 of the 2015 Sony annual report below. You can navigate through the pages in the report by either clicking on the pages listed below, or by using the keyword search tool below to find specific information within the annual report.-
 1
1 -
2
-
3
-
4
-
5
-
6
-
7
-
8
-
9
-
10
-
11
-
12
-
13
-
14
-
15
-
16
-
17
-
18
-
19
-
20
-
21
-
22
-
23
-
24
-
25
-
26
-
27
-
28
-
29
-
30
-
31
-
32
-
33
-
34
-
35
-
36
-
37
-
38
-
39
-
40
-
41
-
42
-
43
-
44
-
45
-
46
-
47
-
48
-
49
-
 50
50 -
 51
51 -
 52
52 -
 53
53 -
 54
54 -
 55
55 -
 56
56 -
 57
57 -
 58
58 -
 59
59 -
 60
60 -
 61
61 -
 62
62 -
 63
63 -
 64
64 -
 65
65 -
 66
66 -
 67
67 -
 68
68 -
 69
69 -
 70
70 -
71
-
72
-
73
-
74
-
75
-
76
-
77
-
78
-
79
-
80
-
81
-
82
-
83
-
84
-
85
-
86
-
87
-
88
-
89
-
90
-
91
-
92
-
93
-
94
-
95
-
96
-
97
-
98
-
99
-
100
-
101
-
102
-
103
-
104
-
105
-
106
-
107
-
108
-
109
-
110
-
111
-
112
-
113
-
114
-
115
-
116
-
117
-
118
-
119
-
120
-
121
-
122
-
123
-
124
-
125
-
126
-
127
-
128
-
129
-
130
-
131
-
132
-
133
-
134
-
135
-
136
-
137
-
138
-
139
-
140
-
141
-
142
-
143
-
144
-
145
-
146
-
147
-
148
-
149
-
150
-
151
-
152
-
153
-
154
-
155
-
156
-
157
-
158
-
159
-
160
-
161
-
162
-
163
-
164
-
165
-
166
-
167
-
168
-
169
-
170
-
171
-
172
-
173
-
174
-
175
-
176
-
177
-
178
-
179
-
180
-
181
-
182
-
183
-
184
-
185
-
186
-
187
-
188
-
189
-
190
-
191
-
192
-
193
-
194
-
195
-
196
-
197
-
198
-
199
-
200
-
201
-
202
-
203
-
204
-
205
-
206
-
207
-
208
-
209
-
210
-
211
-
212
-
213
-
214
-
215
-
216
-
217
-
218
-
219
-
220
-
221
-
222
-
223
-
224
-
225
-
226
-
227
-
228
-
229
-
230
-
231
-
232
 |
 |

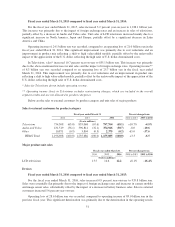
The table below indicates the foreign exchange impact on sales and operating results in each of the
segments. For a detailed analysis of segment performance, please refer to the “Operating Performance Highlights
by Business Segment” in the “Results of Operations” section above, which discusses the impact of foreign
exchange rates within each segment.
Fiscal year ended March 31
Change in yen
Change on constant
currency basis*
Impact of changes in
foreign exchange rates2015 2016
(Yen in billions)
MC Sales 1,410.2 1,127.5 -20.0% -20% -2.4
Operating loss (217.6) (61.4) +156.1 +223.6 -67.5
G&NS Sales 1,388.0 1,551.9 +11.8% +10% +30.2
Operating income 48.1 88.7 +40.6 +88.3 -47.7
IP&S Sales 723.9 711.2 -1.7% -5% +20.6
Operating income 41.8 72.1 +30.4 +31.9 -1.6
HE&S Sales 1,238.1 1,159.0 -6.4% -8% +23.7
Operating income 24.1 50.6 +26.5 +63.1 -36.7
Devices Sales 927.1 935.8 +0.9% -6% +64.9
Operating income (loss) 89.0 (28.6) -117.6 -142.3 +24.7
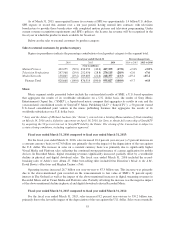
Fiscal year ended March 31
Change in yen
Change on constant
currency basis*
Impact of changes in
foreign exchange rates2014 2015
(Yen in billions)
MC Sales 1,265.0 1,410.2 +11.5% +4% +45.3
Operating income (loss) 8.7 (217.6) -226.3 -167.2 -59.1
G&NS Sales 1,043.9 1,388.0 +33.0% +6% +66.4
Operating income (loss) (18.8) 48.1 +66.9 +96.9 -29.9
IP&S Sales 743.8 723.9 -2.7% +5% +36.2
Operating income 12.2 41.8 +29.6 +22.8 +6.8
HE&S Sales 1,199.7 1,238.1 +3.2% +5% +59.6
Operating income (loss) (21.0) 24.1 +45.1 +69.4 -24.4
Devices Sales 741.8 927.1 +25.0% +9% +67.4
Operating income (loss) (16.9) 89.0 +106.0 +76.9 +29.1
During the fiscal year ended March 31, 2016, sales for the Pictures segment increased 6.8 percent year-on-
year to 938.1 billion yen, while sales were essentially flat on a U.S. dollar basis. In the Music segment, sales
increased 10.4 percent year-on-year to 617.6 billion yen, while sales increased 5 percent year-on-year on a
constant currency basis. During the fiscal year ended March 31, 2015, sales for the Pictures segment increased
5.9 percent year-on-year to 878.7 billion yen, while sales decreased approximately 4 percent on a U.S. dollar
basis. In the Music segment, sales increased 8.2 percent year-on-year to 559.2 billion yen, while sales were
essentially flat year-on-year on a constant currency basis. For a detailed analysis of segment performance, please
refer to the Pictures and Music segments under “Operating Performance by Business Segment.” Sony’s Financial
Services segment consolidates the yen-based results of SFH. As most of the operations in this segment are based
in Japan, Sony management analyzes the performance of the Financial Services segment on a yen basis only.
During the fiscal year ended March 31, 2016, Sony estimated that a one yen appreciation against the
U.S. dollar would have decreased Electronics sales by approximately 18 billion yen, with an increase in operating
income of approximately 7 billion yen. A one yen appreciation against the euro was estimated to decrease
Electronics sales by approximately 9 billion yen, with a corresponding decrease in operating income of
approximately 5 billion yen. For more details, please refer to Foreign exchange rate fluctuations can affect
Sony’s operating results and financial condition. in Risk Factors, under “Item 3. Key Information.”
Sony’s consolidated results are subject to foreign currency rate fluctuations largely because the currency
used in the countries where manufacturing and material and parts procurement takes place may be different from
those where Sony’s products are sold. In order to reduce the risk caused by foreign exchange rate fluctuations,
Sony employs derivatives, including foreign exchange forward contracts and foreign currency option contracts,
in accordance with a consistent risk management strategy. Such derivatives are used primarily to mitigate the
60