Sony 2015 Annual Report Download - page 202
Download and view the complete annual report
Please find page 202 of the 2015 Sony annual report below. You can navigate through the pages in the report by either clicking on the pages listed below, or by using the keyword search tool below to find specific information within the annual report.-
 1
1 -
2
-
3
-
4
-
5
-
6
-
7
-
8
-
9
-
10
-
11
-
12
-
13
-
14
-
15
-
16
-
17
-
18
-
19
-
20
-
21
-
22
-
23
-
24
-
25
-
26
-
27
-
28
-
29
-
30
-
31
-
32
-
33
-
34
-
35
-
36
-
37
-
38
-
39
-
40
-
41
-
42
-
43
-
44
-
45
-
46
-
47
-
48
-
49
-
50
-
51
-
52
-
53
-
54
-
55
-
56
-
57
-
58
-
59
-
60
-
61
-
62
-
63
-
64
-
65
-
66
-
67
-
68
-
69
-
70
-
71
-
72
-
73
-
74
-
75
-
76
-
77
-
78
-
79
-
80
-
81
-
82
-
83
-
84
-
85
-
86
-
87
-
88
-
89
-
90
-
91
-
92
-
93
-
94
-
95
-
96
-
97
-
98
-
99
-
100
-
101
-
102
-
103
-
104
-
105
-
106
-
107
-
108
-
109
-
110
-
111
-
112
-
113
-
114
-
115
-
116
-
117
-
118
-
119
-
120
-
121
-
122
-
123
-
124
-
125
-
126
-
127
-
128
-
129
-
130
-
131
-
132
-
133
-
134
-
135
-
136
-
137
-
138
-
139
-
140
-
141
-
142
-
143
-
144
-
145
-
146
-
147
-
148
-
149
-
150
-
151
-
152
-
153
-
154
-
155
-
156
-
157
-
158
-
159
-
160
-
161
-
162
-
163
-
164
-
165
-
166
-
167
-
168
-
169
-
170
-
171
-
172
-
173
-
174
-
175
-
176
-
177
-
178
-
179
-
180
-
181
-
182
-
183
-
184
-
185
-
186
-
187
-
188
-
189
-
190
-
191
-
 192
192 -
 193
193 -
 194
194 -
 195
195 -
 196
196 -
 197
197 -
 198
198 -
 199
199 -
 200
200 -
 201
201 -
 202
202 -
 203
203 -
 204
204 -
 205
205 -
 206
206 -
 207
207 -
 208
208 -
 209
209 -
 210
210 -
 211
211 -
 212
212 -
213
-
214
-
215
-
216
-
217
-
218
-
219
-
220
-
221
-
222
-
223
-
224
-
225
-
226
-
227
-
228
-
229
-
230
-
231
-
232
 |
 |

SONY CORPORATION AND CONSOLIDATED SUBSIDIARIES
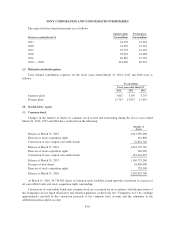
A summary of the activities regarding the stock acquisition rights plan during the fiscal year ended
March 31, 2016 is as follows:
Fiscal year ended March 31, 2016
Number of
shares
Weighted-
average
exercise price
Weighted-
average
remaining life
Total
intrinsic
value
Yen Years Yen in millions
Outstanding at beginning of the fiscal year 16,408,500 3,358
Granted 2,342,000 3,355
Exercised 720,500 2,190
Forfeited or expired 2,251,800 3,976
Outstanding at end of the fiscal year 15,778,200 3,188 5.32 5,246
Exercisable at end of the fiscal year 11,558,300 3,319 3.95 4,133
The total intrinsic value of shares exercised under the stock acquisition rights plan during the fiscal years
ended March 31, 2014, 2015 and 2016 was 52 million yen, 1,463 million yen and 1,338 million yen, respectively.
As of March 31, 2016, there was 2,944 million yen of total unrecognized compensation expense related to
nonvested stock acquisition rights. This expense is expected to be recognized over a weighted-average period of
2.06 years.
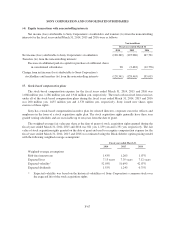
18. Thai Floods
In October 2011, certain of Sony’s Thailand subsidiaries temporarily closed operations due to significant
floods (the “Floods”). The Floods caused significant damage to certain fixed assets including buildings,
machinery and equipment as well as inventories in manufacturing sites and warehouses located in Thailand. In
addition, the Floods impacted the operations of certain Sony subsidiaries in Japan and other countries.
Sony has insurance policies which cover certain damage directly caused by the Floods for Sony Corporation
and certain of its subsidiaries, including manufacturing sites. The insurance policies cover the damage and costs
associated with fixed assets, inventories and additional expenses including removal and cleaning costs and
provide business interruption coverage, including lost profits.
Insurance recoveries were recognized as follows:
Yen in millions
Fiscal year ended March 31
2014 2015 2016
Insurance recoveries for fixed assets, inventories and additional expenses 624 — —
Insurance recoveries for business interruption 11,452 6,387 5,656
12,076 6,387 5,656
The proceeds from insurance recoveries for fixed assets, inventories and additional expenses and for
business interruption were included in investing activities and operating activities, respectively, in the
consolidated statements of cash flows.
F-68