Sony 2015 Annual Report Download - page 224
Download and view the complete annual report
Please find page 224 of the 2015 Sony annual report below. You can navigate through the pages in the report by either clicking on the pages listed below, or by using the keyword search tool below to find specific information within the annual report.-
 1
1 -
2
-
3
-
4
-
5
-
6
-
7
-
8
-
9
-
10
-
11
-
12
-
13
-
14
-
15
-
16
-
17
-
18
-
19
-
20
-
21
-
22
-
23
-
24
-
25
-
26
-
27
-
28
-
29
-
30
-
31
-
32
-
33
-
34
-
35
-
36
-
37
-
38
-
39
-
40
-
41
-
42
-
43
-
44
-
45
-
46
-
47
-
48
-
49
-
50
-
51
-
52
-
53
-
54
-
55
-
56
-
57
-
58
-
59
-
60
-
61
-
62
-
63
-
64
-
65
-
66
-
67
-
68
-
69
-
70
-
71
-
72
-
73
-
74
-
75
-
76
-
77
-
78
-
79
-
80
-
81
-
82
-
83
-
84
-
85
-
86
-
87
-
88
-
89
-
90
-
91
-
92
-
93
-
94
-
95
-
96
-
97
-
98
-
99
-
100
-
101
-
102
-
103
-
104
-
105
-
106
-
107
-
108
-
109
-
110
-
111
-
112
-
113
-
114
-
115
-
116
-
117
-
118
-
119
-
120
-
121
-
122
-
123
-
124
-
125
-
126
-
127
-
128
-
129
-
130
-
131
-
132
-
133
-
134
-
135
-
136
-
137
-
138
-
139
-
140
-
141
-
142
-
143
-
144
-
145
-
146
-
147
-
148
-
149
-
150
-
151
-
152
-
153
-
154
-
155
-
156
-
157
-
158
-
159
-
160
-
161
-
162
-
163
-
164
-
165
-
166
-
167
-
168
-
169
-
170
-
171
-
172
-
173
-
174
-
175
-
176
-
177
-
178
-
179
-
180
-
181
-
182
-
183
-
184
-
185
-
186
-
187
-
188
-
189
-
190
-
191
-
192
-
193
-
194
-
195
-
196
-
197
-
198
-
199
-
200
-
201
-
202
-
203
-
204
-
205
-
206
-
207
-
208
-
209
-
210
-
211
-
212
-
213
-
 214
214 -
 215
215 -
 216
216 -
 217
217 -
 218
218 -
 219
219 -
 220
220 -
 221
221 -
 222
222 -
 223
223 -
 224
224 -
 225
225 -
 226
226 -
 227
227 -
 228
228 -
 229
229 -
 230
230 -
 231
231 -
 232
232
 |
 |

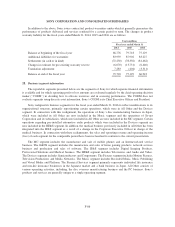
SONY CORPORATION AND CONSOLIDATED SUBSIDIARIES
The following table includes a breakdown of sales and operating revenue to external customers by product
category for certain segments. Sony management views each segment as a single operating segment.
Yen in millions
Fiscal year ended March 31
2014 2015 2016
Sales and operating revenue:
Mobile Communications 1,262,849 1,409,179 1,121,925
Game & Network Services
Hardware 513,425 733,757 721,829
Network 200,229 351,467 529,318
Other 232,825 206,922 228,628
Total 946,479 1,292,146 1,479,775
Imaging Products & Solutions
Digital Imaging Products 442,723 432,594 418,232
Professional Solutions 277,417 271,903 262,675
Other 19,660 15,641 23,561
Total 739,800 720,138 704,468
Home Entertainment & Sound
Televisions 754,308 835,068 797,764
Audio and Video 431,519 396,814 354,946
Other 10,871 3,804 2,375
Total 1,196,698 1,235,686 1,155,085
Devices
Semiconductors 342,072 501,015 558,983
Components 207,833 217,935 197,316
Other 2,493 7,010 10,458
Total 552,398 725,960 766,757
Pictures
Motion Pictures 422,255 434,253 447,355
Television Productions 247,568 252,456 270,115
Media Networks 158,845 189,605 218,357
Total 828,668 876,314 935,827
Music
Recorded Music 347,684 383,350 412,718
Music Publishing 66,869 70,959 71,258
Visual Media and Platform 83,777 86,195 116,993
Total 498,330 540,504 600,969
Financial Services 988,944 1,077,604 1,066,319
All Other 701,089 298,694 242,149
Corporate 52,011 39,655 32,438
Consolidated total 7,767,266 8,215,880 8,105,712
F-90