Sony 2015 Annual Report Download - page 48
Download and view the complete annual report
Please find page 48 of the 2015 Sony annual report below. You can navigate through the pages in the report by either clicking on the pages listed below, or by using the keyword search tool below to find specific information within the annual report.-
 1
1 -
2
-
3
-
4
-
5
-
6
-
7
-
8
-
9
-
10
-
11
-
12
-
13
-
14
-
15
-
16
-
17
-
18
-
19
-
20
-
21
-
22
-
23
-
24
-
25
-
26
-
27
-
28
-
29
-
30
-
31
-
32
-
33
-
34
-
35
-
36
-
37
-
 38
38 -
 39
39 -
 40
40 -
 41
41 -
 42
42 -
 43
43 -
 44
44 -
 45
45 -
 46
46 -
 47
47 -
 48
48 -
 49
49 -
 50
50 -
 51
51 -
 52
52 -
 53
53 -
 54
54 -
 55
55 -
 56
56 -
 57
57 -
 58
58 -
59
-
60
-
61
-
62
-
63
-
64
-
65
-
66
-
67
-
68
-
69
-
70
-
71
-
72
-
73
-
74
-
75
-
76
-
77
-
78
-
79
-
80
-
81
-
82
-
83
-
84
-
85
-
86
-
87
-
88
-
89
-
90
-
91
-
92
-
93
-
94
-
95
-
96
-
97
-
98
-
99
-
100
-
101
-
102
-
103
-
104
-
105
-
106
-
107
-
108
-
109
-
110
-
111
-
112
-
113
-
114
-
115
-
116
-
117
-
118
-
119
-
120
-
121
-
122
-
123
-
124
-
125
-
126
-
127
-
128
-
129
-
130
-
131
-
132
-
133
-
134
-
135
-
136
-
137
-
138
-
139
-
140
-
141
-
142
-
143
-
144
-
145
-
146
-
147
-
148
-
149
-
150
-
151
-
152
-
153
-
154
-
155
-
156
-
157
-
158
-
159
-
160
-
161
-
162
-
163
-
164
-
165
-
166
-
167
-
168
-
169
-
170
-
171
-
172
-
173
-
174
-
175
-
176
-
177
-
178
-
179
-
180
-
181
-
182
-
183
-
184
-
185
-
186
-
187
-
188
-
189
-
190
-
191
-
192
-
193
-
194
-
195
-
196
-
197
-
198
-
199
-
200
-
201
-
202
-
203
-
204
-
205
-
206
-
207
-
208
-
209
-
210
-
211
-
212
-
213
-
214
-
215
-
216
-
217
-
218
-
219
-
220
-
221
-
222
-
223
-
224
-
225
-
226
-
227
-
228
-
229
-
230
-
231
-
232
 |
 |

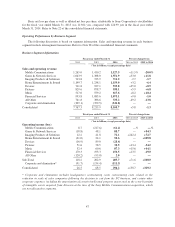
Mobile Communications
Fiscal year ended March 31, 2016 compared to fiscal year ended March 31, 2015:
For the fiscal year ended March 31, 2016, sales decreased 20.0 percent year-on-year to 1,127.5 billion yen.
This decrease was due to a strategic decision not to pursue scale in order to improve profitability, resulting in a
significant decrease in smartphone unit sales, partially offset by an improvement in the product mix of
smartphones reflecting an increased focus on high value-added models.
Operating loss decreased 156.1 billion yen year-on-year to 61.4 billion yen. This significant decrease was
primarily due to the absence of 176.0 billion yen goodwill impairment charge recorded in the fiscal year ended
March 31, 2015. The operating results were also primarily affected by the negative impact of the appreciation of
the U.S. dollar, reflecting a high ratio of U.S. dollar-denominated costs, and an increase in restructuring charges.
The negative impact of the above-mentioned decrease in smartphone unit sales was offset by the improvement in
product mix, as well as cost reductions.
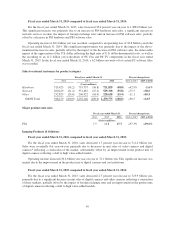
Fiscal year ended March 31, 2015 compared to fiscal year ended March 31, 2014:
For the fiscal year ended March 31, 2015, sales increased 11.5 percent year-on-year to 1,410.2 billion yen,
primarily due to an improvement in product mix as a result of a focus on high value-added models and the impact
of foreign exchange rates.
Operating loss of 217.6 billion yen was recorded, compared to operating income of 8.7 billion yen in the
fiscal year ended March 31, 2014. This significant deterioration was primarily due to the 176.0 billion yen
impairment of goodwill* recorded in this segment and the unfavorable impact of the appreciation of the
U.S. dollar, reflecting the high ratio of U.S. dollar-denominated costs, partially offset by the above-mentioned
improvement in product mix.
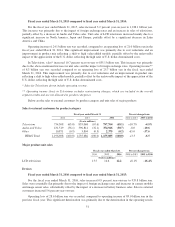
* In July 2014, Sony began a review of its mid-range plan (“MRP”) for the MC segment. In September 2014, in
light of the historical results, the operating environment surrounding this segment and the need to address the
significant change in the market and competitive environment of the mobile business, Sony revised the MRP for
the MC segment. The new MRP reflected lower expected future cash flows compared to the previous MRP.
Additionally the revision included changing the strategy of the MC segment in certain geographical areas and
concentrating on its premium lineup. As a result, Sony determined that the fair value of the MC business had
decreased.
Major product unit sales
Fiscal year ended March 31 Percent change from
2014 2015 2016 2014 to 2015 2015 to 2016
(Units in millions)
Smartphones within Mobile Communications 39.1 39.1 24.9 0% -36.3%
Game & Network Services
Fiscal year ended March 31, 2016 compared to fiscal year ended March 31, 2015:
For the fiscal year ended March 31, 2016, sales increased 11.8 percent year-on-year to 1,551.9 billion yen.
This significant increase was primarily due to increases in PS4 software sales, including sales through the
network, and PS4 hardware unit sales, partially offset by a decrease in PlayStation®3 (“PS3”) software and
hardware sales.
Operating income increased 40.6 billion yen year-on-year to 88.7 billion yen. This significant increase was
primarily due to the increase in PS4 software sales and PS4 hardware cost reductions as well as the absence in
the fiscal year ended March 31, 2016 of an 11.2 billion yen write-down of PS Vita and PS TV components
recorded in the fiscal year ended March 31, 2015. Partially offsetting the increase in operating income were the
negative impact of the appreciation of the U.S. dollar, reflecting a high ratio of U.S. dollar-denominated costs,
and the decrease in PS3 software sales.
48