Sony 2015 Annual Report Download - page 50
Download and view the complete annual report
Please find page 50 of the 2015 Sony annual report below. You can navigate through the pages in the report by either clicking on the pages listed below, or by using the keyword search tool below to find specific information within the annual report.-
 1
1 -
2
-
3
-
4
-
5
-
6
-
7
-
8
-
9
-
10
-
11
-
12
-
13
-
14
-
15
-
16
-
17
-
18
-
19
-
20
-
21
-
22
-
23
-
24
-
25
-
26
-
27
-
28
-
29
-
30
-
31
-
32
-
33
-
34
-
35
-
36
-
37
-
38
-
39
-
 40
40 -
 41
41 -
 42
42 -
 43
43 -
 44
44 -
 45
45 -
 46
46 -
 47
47 -
 48
48 -
 49
49 -
 50
50 -
 51
51 -
 52
52 -
 53
53 -
 54
54 -
 55
55 -
 56
56 -
 57
57 -
 58
58 -
 59
59 -
 60
60 -
61
-
62
-
63
-
64
-
65
-
66
-
67
-
68
-
69
-
70
-
71
-
72
-
73
-
74
-
75
-
76
-
77
-
78
-
79
-
80
-
81
-
82
-
83
-
84
-
85
-
86
-
87
-
88
-
89
-
90
-
91
-
92
-
93
-
94
-
95
-
96
-
97
-
98
-
99
-
100
-
101
-
102
-
103
-
104
-
105
-
106
-
107
-
108
-
109
-
110
-
111
-
112
-
113
-
114
-
115
-
116
-
117
-
118
-
119
-
120
-
121
-
122
-
123
-
124
-
125
-
126
-
127
-
128
-
129
-
130
-
131
-
132
-
133
-
134
-
135
-
136
-
137
-
138
-
139
-
140
-
141
-
142
-
143
-
144
-
145
-
146
-
147
-
148
-
149
-
150
-
151
-
152
-
153
-
154
-
155
-
156
-
157
-
158
-
159
-
160
-
161
-
162
-
163
-
164
-
165
-
166
-
167
-
168
-
169
-
170
-
171
-
172
-
173
-
174
-
175
-
176
-
177
-
178
-
179
-
180
-
181
-
182
-
183
-
184
-
185
-
186
-
187
-
188
-
189
-
190
-
191
-
192
-
193
-
194
-
195
-
196
-
197
-
198
-
199
-
200
-
201
-
202
-
203
-
204
-
205
-
206
-
207
-
208
-
209
-
210
-
211
-
212
-
213
-
214
-
215
-
216
-
217
-
218
-
219
-
220
-
221
-
222
-
223
-
224
-
225
-
226
-
227
-
228
-
229
-
230
-
231
-
232
 |
 |

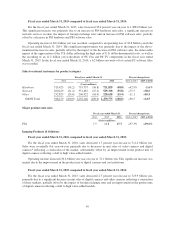
Operating income increased 29.6 billion yen year-on-year to 41.8 billion yen. This significant increase was
mainly due to a reduction in selling, general and administrative expenses, the favorable impact of foreign
exchange rates and the above-mentioned improvement in product mix reflecting a shift to high value-added
models, partially offset by the above-mentioned decrease in sales of digital cameras and video cameras.
* Digital cameras includes compact digital cameras, interchangeable single-lens cameras and interchangeable
lenses.
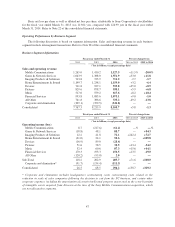
Below are the sales to external customers by product category and unit sales of major products:
Sales to external customers by product category
Figures in parentheses indicate the percentage contribution of each product category to the segment total.
Fiscal year ended March 31 Percent change from
2014 2015 2016 2014 to 2015 2015 to 2016
(Yen in millions)
Digital Imaging
Products 442,723 (59.8) 432,594 (60.1) 418,232 (59.4) -2.3% -3.3%
Professional Solutions 277,417 (37.5) 271,903 (37.8) 262,675 (37.3) -2.0 -3.4
Other 19,660 (2.7) 15,641 (2.1) 23,561 (3.3) -20.4 +50.6
IP&S Total 739,800 (100.0) 720,138 (100.0) 704,468 (100.0) -2.7 -2.2
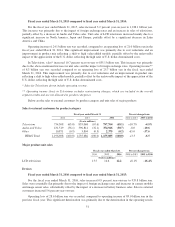
Major product unit sales
Fiscal year ended March 31 Percent change from
2014 2015 2016 2014 to 2015 2015 to 2016
(Units in millions)
Digital cameras within Digital Imaging Products* 11.5 8.5 6.1 -26.1% -28.2%
* Digital cameras include compact digital cameras, interchangeable single-lens cameras, and interchangeable
lenses.
Home Entertainment & Sound
Fiscal year ended March 31, 2016 compared to fiscal year ended March 31, 2015:
For the fiscal year ended March 31, 2016, sales decreased 6.4 percent year-on-year to 1,159.0 billion
yen. This decrease was primarily due to a decrease in unit sales of LCD televisions, and a decrease in home audio
and video unit sales reflecting a contraction of the market, partially offset by an improvement in the product mix
of LCD televisions reflecting a shift to high value-added models, as well as the impact of foreign exchange rates.
Operating income increased 26.5 billion yen year-on-year to 50.6 billion yen. This significant increase was
primarily due to cost reductions and an improvement in product mix, partially offset by the negative impact of
the appreciation of the U.S. dollar, reflecting the high ratio of U.S. dollar-denominated costs, as well as the
impact of the above-mentioned decrease in sales.
In Televisions, sales* decreased 4.5 percent year-on-year to 797.8 billion yen. This was primarily due to a
decrease in LCD television unit sales resulting from a strategic decision not to pursue scale in order to improve
profitability and the impact of foreign exchange rates, partially offset by the improvement in product mix
reflecting a shift to high value-added models. Operating income** increased 17.5 billion yen year-on-year to
25.8 billion yen. This increase was primarily due to cost reductions and the improvement in product mix,
partially offset by the negative impact of the appreciation of the U.S. dollar, reflecting the high ratio of U.S.
dollar-denominated costs, and the impact of the decrease in unit sales.
50