Sony 2015 Annual Report Download - page 221
Download and view the complete annual report
Please find page 221 of the 2015 Sony annual report below. You can navigate through the pages in the report by either clicking on the pages listed below, or by using the keyword search tool below to find specific information within the annual report.-
 1
1 -
2
-
3
-
4
-
5
-
6
-
7
-
8
-
9
-
10
-
11
-
12
-
13
-
14
-
15
-
16
-
17
-
18
-
19
-
20
-
21
-
22
-
23
-
24
-
25
-
26
-
27
-
28
-
29
-
30
-
31
-
32
-
33
-
34
-
35
-
36
-
37
-
38
-
39
-
40
-
41
-
42
-
43
-
44
-
45
-
46
-
47
-
48
-
49
-
50
-
51
-
52
-
53
-
54
-
55
-
56
-
57
-
58
-
59
-
60
-
61
-
62
-
63
-
64
-
65
-
66
-
67
-
68
-
69
-
70
-
71
-
72
-
73
-
74
-
75
-
76
-
77
-
78
-
79
-
80
-
81
-
82
-
83
-
84
-
85
-
86
-
87
-
88
-
89
-
90
-
91
-
92
-
93
-
94
-
95
-
96
-
97
-
98
-
99
-
100
-
101
-
102
-
103
-
104
-
105
-
106
-
107
-
108
-
109
-
110
-
111
-
112
-
113
-
114
-
115
-
116
-
117
-
118
-
119
-
120
-
121
-
122
-
123
-
124
-
125
-
126
-
127
-
128
-
129
-
130
-
131
-
132
-
133
-
134
-
135
-
136
-
137
-
138
-
139
-
140
-
141
-
142
-
143
-
144
-
145
-
146
-
147
-
148
-
149
-
150
-
151
-
152
-
153
-
154
-
155
-
156
-
157
-
158
-
159
-
160
-
161
-
162
-
163
-
164
-
165
-
166
-
167
-
168
-
169
-
170
-
171
-
172
-
173
-
174
-
175
-
176
-
177
-
178
-
179
-
180
-
181
-
182
-
183
-
184
-
185
-
186
-
187
-
188
-
189
-
190
-
191
-
192
-
193
-
194
-
195
-
196
-
197
-
198
-
199
-
200
-
201
-
202
-
203
-
204
-
205
-
206
-
207
-
208
-
209
-
210
-
 211
211 -
 212
212 -
 213
213 -
 214
214 -
 215
215 -
 216
216 -
 217
217 -
 218
218 -
 219
219 -
 220
220 -
 221
221 -
 222
222 -
 223
223 -
 224
224 -
 225
225 -
 226
226 -
 227
227 -
 228
228 -
 229
229 -
 230
230 -
 231
231 -
232
 |
 |

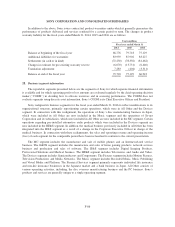
SONY CORPORATION AND CONSOLIDATED SUBSIDIARIES
Segment sales and operating revenue:
Yen in millions
Fiscal year ended March 31
2014 2015 2016
Sales and operating revenue:
Mobile Communications —
Customers 1,262,849 1,409,179 1,121,925
Intersegment 2,165 1,036 5,548
Total 1,265,014 1,410,215 1,127,473
Game & Network Services —
Customers 946,479 1,292,146 1,479,775
Intersegment 97,379 95,883 72,118
Total 1,043,858 1,388,029 1,551,893
Imaging Products & Solutions —
Customers 739,800 720,138 704,468
Intersegment 4,005 3,712 6,724
Total 743,805 723,850 711,192
Home Entertainment & Sound —
Customers 1,196,698 1,235,686 1,155,085
Intersegment 3,040 2,371 3,957
Total 1,199,738 1,238,057 1,159,042
Devices —
Customers 552,398 725,960 766,757
Intersegment 189,422 201,120 169,023
Total 741,820 927,080 935,780
Pictures —
Customers 828,668 876,314 935,827
Intersegment 916 2,367 2,315
Total 829,584 878,681 938,142
Music —
Customers 498,330 540,504 600,969
Intersegment 18,626 18,740 16,675
Total 516,956 559,244 617,644
Financial Services —
Customers 988,944 1,077,604 1,066,319
Intersegment 4,902 6,025 6,750
Total 993,846 1,083,629 1,073,069
All Other —
Customers 701,089 298,694 242,149
Intersegment 60,683 87,909 91,092
Total 761,772 386,603 333,241
Corporate and elimination (329,127) (379,508) (341,764)
Consolidated total 7,767,266 8,215,880 8,105,712
G&NS intersegment amounts primarily consist of transactions with All Other. Devices intersegment
amounts primarily consist of transactions with the MC segment, the G&NS segment and the IP&S segment. All
Other intersegment amounts primarily consist of transactions with the Pictures segment, the Music segment and
the G&NS segment. Corporate and elimination includes certain brand and patent royalty income.
F-87