Sony 2015 Annual Report Download - page 57
Download and view the complete annual report
Please find page 57 of the 2015 Sony annual report below. You can navigate through the pages in the report by either clicking on the pages listed below, or by using the keyword search tool below to find specific information within the annual report.-
 1
1 -
2
-
3
-
4
-
5
-
6
-
7
-
8
-
9
-
10
-
11
-
12
-
13
-
14
-
15
-
16
-
17
-
18
-
19
-
20
-
21
-
22
-
23
-
24
-
25
-
26
-
27
-
28
-
29
-
30
-
31
-
32
-
33
-
34
-
35
-
36
-
37
-
38
-
39
-
40
-
41
-
42
-
43
-
44
-
45
-
46
-
 47
47 -
 48
48 -
 49
49 -
 50
50 -
 51
51 -
 52
52 -
 53
53 -
 54
54 -
 55
55 -
 56
56 -
 57
57 -
 58
58 -
 59
59 -
 60
60 -
 61
61 -
 62
62 -
 63
63 -
 64
64 -
 65
65 -
 66
66 -
 67
67 -
68
-
69
-
70
-
71
-
72
-
73
-
74
-
75
-
76
-
77
-
78
-
79
-
80
-
81
-
82
-
83
-
84
-
85
-
86
-
87
-
88
-
89
-
90
-
91
-
92
-
93
-
94
-
95
-
96
-
97
-
98
-
99
-
100
-
101
-
102
-
103
-
104
-
105
-
106
-
107
-
108
-
109
-
110
-
111
-
112
-
113
-
114
-
115
-
116
-
117
-
118
-
119
-
120
-
121
-
122
-
123
-
124
-
125
-
126
-
127
-
128
-
129
-
130
-
131
-
132
-
133
-
134
-
135
-
136
-
137
-
138
-
139
-
140
-
141
-
142
-
143
-
144
-
145
-
146
-
147
-
148
-
149
-
150
-
151
-
152
-
153
-
154
-
155
-
156
-
157
-
158
-
159
-
160
-
161
-
162
-
163
-
164
-
165
-
166
-
167
-
168
-
169
-
170
-
171
-
172
-
173
-
174
-
175
-
176
-
177
-
178
-
179
-
180
-
181
-
182
-
183
-
184
-
185
-
186
-
187
-
188
-
189
-
190
-
191
-
192
-
193
-
194
-
195
-
196
-
197
-
198
-
199
-
200
-
201
-
202
-
203
-
204
-
205
-
206
-
207
-
208
-
209
-
210
-
211
-
212
-
213
-
214
-
215
-
216
-
217
-
218
-
219
-
220
-
221
-
222
-
223
-
224
-
225
-
226
-
227
-
228
-
229
-
230
-
231
-
232
 |
 |

Information on Operations Separating Out the Financial Services Segment
The following charts show Sony’s information on operations for the Financial Services segment alone and
for all segments excluding the Financial Services segment. These separate condensed presentations are not
required or prepared under U.S. GAAP, which is used in Sony’s consolidated financial statements. However,
because the Financial Services segment is different in nature from Sony’s other segments, Sony utilizes this
information to analyze its results without the Financial Services segment and believes that these presentations
may be useful in understanding and analyzing Sony’s consolidated financial statements. Transactions between
the Financial Services segment and Sony without the Financial Services segment, including noncontrolling
interests, are included in those respective presentations, then eliminated in the consolidated figures shown below.
Fiscal year ended March 31
Financial Services segment 2014 2015 2016
(Yen in millions)
Financial services revenue 993,846 1,083,629 1,073,069
Financial services expenses 821,218 889,540 915,881
Equity in net loss of affiliated companies (2,336) (782) (645)
Operating income 170,292 193,307 156,543
Other income, net 2 — —
Income before income taxes 170,294 193,307 156,543
Income taxes and other 54,161 42,184 37,741
Net income of Financial Services 116,133 151,123 118,802
Fiscal year ended March 31
Sony without the Financial Services segment 2014 2015 2016
(Yen in millions)
Net sales and operating revenue 6,780,504 7,141,492 7,044,415
Costs and expenses 6,921,294 7,218,528 6,909,651
Equity in net income (loss) of affiliated companies (5,038) 4,703 2,883
Operating income (loss) (145,828) (72,333) 137,647
Other income (expenses), net 7,800 (20,987) 20,755
Income (loss) before income taxes (138,028) (93,320) 158,402
Income taxes and other 53,290 63,094 71,451
Net income (loss) of Sony without Financial Services (191,318) (156,414) 86,951
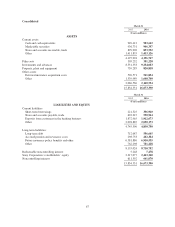
Fiscal year ended March 31
Consolidated 2014 2015 2016
(Yen in millions)
Financial services revenue 988,944 1,077,604 1,066,319
Net sales and operating revenue 6,778,322 7,138,276 7,039,393
7,767,266 8,215,880 8,105,712
Costs and expenses 7,733,397 8,151,253 7,813,753
Equity in net income (loss) of affiliated companies (7,374) 3,921 2,238
Operating income 26,495 68,548 294,197
Other income (expenses), net (754) (28,819) 10,307
Income before income taxes 25,741 39,729 304,504
Income taxes and other 154,110 165,709 156,713
Net income (loss) attributable to Sony Corporation’s
Stockholders (128,369) (125,980) 147,791
57