Sony 2015 Annual Report Download - page 225
Download and view the complete annual report
Please find page 225 of the 2015 Sony annual report below. You can navigate through the pages in the report by either clicking on the pages listed below, or by using the keyword search tool below to find specific information within the annual report.-
 1
1 -
2
-
3
-
4
-
5
-
6
-
7
-
8
-
9
-
10
-
11
-
12
-
13
-
14
-
15
-
16
-
17
-
18
-
19
-
20
-
21
-
22
-
23
-
24
-
25
-
26
-
27
-
28
-
29
-
30
-
31
-
32
-
33
-
34
-
35
-
36
-
37
-
38
-
39
-
40
-
41
-
42
-
43
-
44
-
45
-
46
-
47
-
48
-
49
-
50
-
51
-
52
-
53
-
54
-
55
-
56
-
57
-
58
-
59
-
60
-
61
-
62
-
63
-
64
-
65
-
66
-
67
-
68
-
69
-
70
-
71
-
72
-
73
-
74
-
75
-
76
-
77
-
78
-
79
-
80
-
81
-
82
-
83
-
84
-
85
-
86
-
87
-
88
-
89
-
90
-
91
-
92
-
93
-
94
-
95
-
96
-
97
-
98
-
99
-
100
-
101
-
102
-
103
-
104
-
105
-
106
-
107
-
108
-
109
-
110
-
111
-
112
-
113
-
114
-
115
-
116
-
117
-
118
-
119
-
120
-
121
-
122
-
123
-
124
-
125
-
126
-
127
-
128
-
129
-
130
-
131
-
132
-
133
-
134
-
135
-
136
-
137
-
138
-
139
-
140
-
141
-
142
-
143
-
144
-
145
-
146
-
147
-
148
-
149
-
150
-
151
-
152
-
153
-
154
-
155
-
156
-
157
-
158
-
159
-
160
-
161
-
162
-
163
-
164
-
165
-
166
-
167
-
168
-
169
-
170
-
171
-
172
-
173
-
174
-
175
-
176
-
177
-
178
-
179
-
180
-
181
-
182
-
183
-
184
-
185
-
186
-
187
-
188
-
189
-
190
-
191
-
192
-
193
-
194
-
195
-
196
-
197
-
198
-
199
-
200
-
201
-
202
-
203
-
204
-
205
-
206
-
207
-
208
-
209
-
210
-
211
-
212
-
213
-
214
-
 215
215 -
 216
216 -
 217
217 -
 218
218 -
 219
219 -
 220
220 -
 221
221 -
 222
222 -
 223
223 -
 224
224 -
 225
225 -
 226
226 -
 227
227 -
 228
228 -
 229
229 -
 230
230 -
 231
231 -
 232
232
 |
 |

SONY CORPORATION AND CONSOLIDATED SUBSIDIARIES
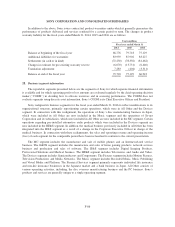
Geographic Information:
Sales and operating revenue attributed to countries and areas based on location of external customers for the
fiscal years ended March 31, 2014, 2015 and 2016 and property, plant and equipment, net as of March 31, 2015
and 2016 are as follows:
Yen in millions
Fiscal year ended March 31
2014 2015 2016
Sales and operating revenue:
Japan 2,199,099 2,233,776 2,317,312
United States 1,302,052 1,528,097 1,733,759
Europe 1,753,526 1,932,941 1,881,329
China 520,539 546,697 540,497
Asia-Pacific 1,013,635 1,052,453 959,171
Other Areas 978,415 921,916 673,644
Total 7,767,266 8,215,880 8,105,712
Yen in millions
March 31
2015 2016
Property, plant and equipment, net:
Japan 495,502 625,143
United States 85,412 99,743
Europe 38,637 31,738
China 69,854 19,884
Asia-Pacific 41,096 37,042
Other Areas 8,784 7,268
Total 739,285 820,818
Major countries and areas in each geographic segment excluding Japan, United States and China are as
follows:
(1) Europe: United Kingdom, France, Germany, Russia, Spain and Sweden
(2) Asia-Pacific: India, South Korea and Oceania
(3) Other Areas: The Middle East/Africa, Brazil, Mexico and Canada
There are no individually material countries with respect to sales and operating revenue or property, plant
and equipment, net included in Europe, Asia-Pacific and Other Areas.
Transfers between reportable business segments or geographic areas are made at amounts which Sony’s
management believes approximate arms-length transactions.
There were no sales and operating revenue with any single major external customer for the fiscal years
ended March 31, 2014, 2015 and 2016.
F-91