Sony 2015 Annual Report Download - page 209
Download and view the complete annual report
Please find page 209 of the 2015 Sony annual report below. You can navigate through the pages in the report by either clicking on the pages listed below, or by using the keyword search tool below to find specific information within the annual report.-
 1
1 -
2
-
3
-
4
-
5
-
6
-
7
-
8
-
9
-
10
-
11
-
12
-
13
-
14
-
15
-
16
-
17
-
18
-
19
-
20
-
21
-
22
-
23
-
24
-
25
-
26
-
27
-
28
-
29
-
30
-
31
-
32
-
33
-
34
-
35
-
36
-
37
-
38
-
39
-
40
-
41
-
42
-
43
-
44
-
45
-
46
-
47
-
48
-
49
-
50
-
51
-
52
-
53
-
54
-
55
-
56
-
57
-
58
-
59
-
60
-
61
-
62
-
63
-
64
-
65
-
66
-
67
-
68
-
69
-
70
-
71
-
72
-
73
-
74
-
75
-
76
-
77
-
78
-
79
-
80
-
81
-
82
-
83
-
84
-
85
-
86
-
87
-
88
-
89
-
90
-
91
-
92
-
93
-
94
-
95
-
96
-
97
-
98
-
99
-
100
-
101
-
102
-
103
-
104
-
105
-
106
-
107
-
108
-
109
-
110
-
111
-
112
-
113
-
114
-
115
-
116
-
117
-
118
-
119
-
120
-
121
-
122
-
123
-
124
-
125
-
126
-
127
-
128
-
129
-
130
-
131
-
132
-
133
-
134
-
135
-
136
-
137
-
138
-
139
-
140
-
141
-
142
-
143
-
144
-
145
-
146
-
147
-
148
-
149
-
150
-
151
-
152
-
153
-
154
-
155
-
156
-
157
-
158
-
159
-
160
-
161
-
162
-
163
-
164
-
165
-
166
-
167
-
168
-
169
-
170
-
171
-
172
-
173
-
174
-
175
-
176
-
177
-
178
-
179
-
180
-
181
-
182
-
183
-
184
-
185
-
186
-
187
-
188
-
189
-
190
-
191
-
192
-
193
-
194
-
195
-
196
-
197
-
198
-
 199
199 -
 200
200 -
 201
201 -
 202
202 -
 203
203 -
 204
204 -
 205
205 -
 206
206 -
 207
207 -
 208
208 -
 209
209 -
 210
210 -
 211
211 -
 212
212 -
 213
213 -
 214
214 -
 215
215 -
 216
216 -
 217
217 -
 218
218 -
 219
219 -
220
-
221
-
222
-
223
-
224
-
225
-
226
-
227
-
228
-
229
-
230
-
231
-
232
 |
 |

SONY CORPORATION AND CONSOLIDATED SUBSIDIARIES
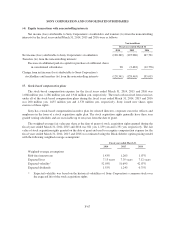
should be allocated to a loss from continuing operations. During the fiscal years ended March 31, 2014 and 2015,
Sony Corporation and its national tax filing group in Japan and certain other jurisdictions incurred a loss from
continuing operations while also recording other comprehensive income. As a result, Sony allocated
28,797 million yen and 10,799 million yen of tax benefit to continuing operations, respectively, which was
exactly offset by additional income tax expense in other comprehensive income. The total income tax provision
did not change and these jurisdictions continue to be impacted by the full valuation allowance on deferred tax
assets. During the fiscal year ended March 31, 2016, there was no application of the intraperiod allocation rules
as no jurisdictions met the necessary criteria.
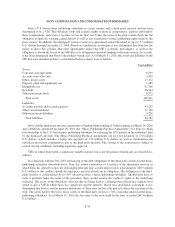
The significant components of deferred tax assets and liabilities are as follows:
Yen in millions
March 31
2015 2016
Deferred tax assets:
Operating loss carryforwards for tax purposes 550,824 483,590
Accrued pension and severance costs 89,797 131,262
Film costs 177,741 175,439
Warranty reserves and accrued expenses 103,695 96,327
Future insurance policy benefits 25,304 27,419
Inventory 35,478 38,219
Depreciation 57,140 48,339
Tax credit carryforwards 105,645 145,011
Reserve for doubtful accounts 9,455 10,179
Impairment of investments 22,444 47,083
Deferred revenue in the Pictures segment 24,438 16,336
Other 165,552 140,218
Gross deferred tax assets 1,367,513 1,359,422
Less: Valuation allowance (1,077,622) (1,055,858)
Total deferred tax assets 289,891 303,564
Deferred tax liabilities:
Insurance acquisition costs (150,677) (144,207)
Future insurance policy benefits (112,996) (132,521)
Unbilled accounts receivable in the Pictures segment (83,472) (99,625)
Unrealized gains on securities (94,065) (97,745)
Intangible assets acquired through stock exchange offerings (24,927) (23,794)
Undistributed earnings of foreign subsidiaries and corporate joint
ventures (35,076) (33,933)
Investment in M3 (37,342) (35,666)
Other (66,556) (53,750)
Gross deferred tax liabilities (605,111) (621,241)
Net deferred tax liabilities (315,220) (317,677)
Based on the weight of the available positive and negative evidence, for the fiscal year ended March 31,
2016, Sony continued to maintain valuation allowances against the deferred tax assets at Sony Corporation and
its national tax filing group in Japan, as well as at Sony Americas Holding Inc. (“SAHI”) and its consolidated tax
filing group, Sony Mobile Communications in Sweden, Sony Europe Limited (“SEU”) in the U.K., certain
subsidiaries in Brazil, and certain subsidiaries in other tax jurisdictions.
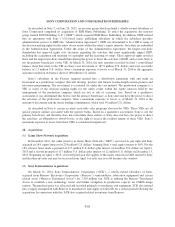
The net changes in the total valuation allowance were increases of 96,283 million yen and 50,092 million
yen for the fiscal years ended March 31, 2014 and 2015, respectively, and a decrease of 21,764 million yen for
the fiscal year ended March 31, 2016.
F-75