Sony 2015 Annual Report Download - page 61
Download and view the complete annual report
Please find page 61 of the 2015 Sony annual report below. You can navigate through the pages in the report by either clicking on the pages listed below, or by using the keyword search tool below to find specific information within the annual report.-
 1
1 -
2
-
3
-
4
-
5
-
6
-
7
-
8
-
9
-
10
-
11
-
12
-
13
-
14
-
15
-
16
-
17
-
18
-
19
-
20
-
21
-
22
-
23
-
24
-
25
-
26
-
27
-
28
-
29
-
30
-
31
-
32
-
33
-
34
-
35
-
36
-
37
-
38
-
39
-
40
-
41
-
42
-
43
-
44
-
45
-
46
-
47
-
48
-
49
-
50
-
 51
51 -
 52
52 -
 53
53 -
 54
54 -
 55
55 -
 56
56 -
 57
57 -
 58
58 -
 59
59 -
 60
60 -
 61
61 -
 62
62 -
 63
63 -
 64
64 -
 65
65 -
 66
66 -
 67
67 -
 68
68 -
 69
69 -
 70
70 -
 71
71 -
72
-
73
-
74
-
75
-
76
-
77
-
78
-
79
-
80
-
81
-
82
-
83
-
84
-
85
-
86
-
87
-
88
-
89
-
90
-
91
-
92
-
93
-
94
-
95
-
96
-
97
-
98
-
99
-
100
-
101
-
102
-
103
-
104
-
105
-
106
-
107
-
108
-
109
-
110
-
111
-
112
-
113
-
114
-
115
-
116
-
117
-
118
-
119
-
120
-
121
-
122
-
123
-
124
-
125
-
126
-
127
-
128
-
129
-
130
-
131
-
132
-
133
-
134
-
135
-
136
-
137
-
138
-
139
-
140
-
141
-
142
-
143
-
144
-
145
-
146
-
147
-
148
-
149
-
150
-
151
-
152
-
153
-
154
-
155
-
156
-
157
-
158
-
159
-
160
-
161
-
162
-
163
-
164
-
165
-
166
-
167
-
168
-
169
-
170
-
171
-
172
-
173
-
174
-
175
-
176
-
177
-
178
-
179
-
180
-
181
-
182
-
183
-
184
-
185
-
186
-
187
-
188
-
189
-
190
-
191
-
192
-
193
-
194
-
195
-
196
-
197
-
198
-
199
-
200
-
201
-
202
-
203
-
204
-
205
-
206
-
207
-
208
-
209
-
210
-
211
-
212
-
213
-
214
-
215
-
216
-
217
-
218
-
219
-
220
-
221
-
222
-
223
-
224
-
225
-
226
-
227
-
228
-
229
-
230
-
231
-
232
 |
 |
effect of foreign currency exchange rate fluctuations on cash flows generated or anticipated by Sony Corporation
and by its subsidiaries’ transactions and accounts receivable and payable denominated in foreign currencies.
Sony Global Treasury Services Plc (“SGTS”) in London provides integrated treasury services for Sony
Corporation, its subsidiaries, and affiliated companies. Sony’s policy is that Sony Corporation and all
subsidiaries with foreign exchange exposures should enter into commitments with SGTS to hedge their
exposures. Sony Corporation and most of its subsidiaries utilize SGTS for this purpose. Sony’s policy of
concentrating its foreign exchange exposures means that SGTS and Sony Corporation hedge most of the net
foreign exchange exposure within the Sony group. Sony has a policy on the use of derivatives that, in principle,
SGTS should centrally deal with and manage derivatives with financial institutions for risk management
purposes. SGTS enters into foreign exchange transactions with creditworthy third-party financial institutions.
Most of these transactions are entered into against projected exposures before the actual export and import
transactions take place. In general, SGTS hedges the projected exposures for a period of one to three months
before the actual transactions take place. Sony enters into foreign exchange transactions with financial
institutions primarily for hedging purposes. Sony does not use these derivative financial instruments for trading
or speculative purposes except for certain derivatives in the Financial Services segment. In the Financial Services
segment, Sony uses derivatives primarily for asset liability management.
To minimize the effects of foreign exchange fluctuations on its financial results, particularly in the
Electronics segments, Sony seeks, when appropriate, to localize material and parts procurement, design and
manufacturing operations in areas outside of Japan.
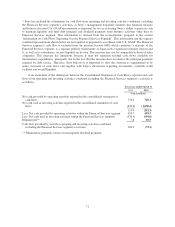
Changes in the fair value of derivatives designated as cash flow hedges are initially recorded in accumulated
other comprehensive income and reclassified into earnings when the hedged transaction affects earnings. Foreign
exchange forward contracts, foreign currency option contracts and other derivatives that do not qualify as hedges
are marked-to-market with changes in value recognized in other income and expenses. The notional amount of all
the foreign exchange derivative contracts as of March 31, 2015 and 2016 was 2,184.3 billion yen and
1,835.2 billion yen, respectively. The net fair value of all the foreign exchange derivative contracts as of
March 31, 2015 and 2016 was an asset of 8.3 billion yen and a liability of 2.5 billion yen, respectively. Refer to
Note 14 of the consolidated financial statements.
* Note: In this section, for all segments other than Pictures and Music, the impact of foreign exchange rate
fluctuations on sales is calculated by applying the change in the yen’s periodic weighted average exchange rates
for the fiscal year ended March 31, 2015 from the fiscal year ended March 31, 2016 to the major transactional
currencies in which the sales are denominated. The impact of foreign exchange rate fluctuations on operating
income (loss) described herein is calculated by subtracting from the impact on sales the impact on cost of sales
and selling, general and administrative expenses calculated by applying the same major transactional currencies
calculation process to cost of sales and selling, general and administrative expenses as for the impact on sales.
Since the worldwide subsidiaries of the Pictures segment and of SME and Sony/ATV in the Music segment are
aggregated on a U.S. dollar basis and are translated into yen, the impact of foreign exchange rate fluctuations is
calculated by applying the change in the periodic weighted average exchange rates for the fiscal year ended
March 31, 2015 from the fiscal year ended March 31, 2016 from U.S. dollar to yen to the U.S. dollar basis
operating results. This information is not a substitute for Sony’s consolidated financial statements measured in
accordance with U.S. GAAP. However, Sony believes that these disclosures provide additional useful analytical
information to investors regarding the operating performance of Sony.
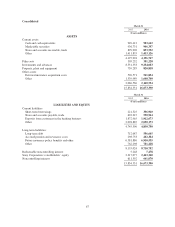
Assets, Liabilities and Stockholders’ Equity
Assets
Total assets as of March 31, 2016 increased by 839.1 billion yen, or 5.3 percent year-on-year, to
16,673.4 billion yen. Total assets as of March 31, 2016 in all segments, excluding the Financial Services
segment, increased by 14.6 billion yen, or 0.2 percent year-on-year, to 5,956.6 billion yen. Total assets as of
March 31, 2016 in the Financial Services segment increased by 825.7 billion yen, or 8.2 percent year-on-year, to
10,915.5 billion yen.
61