Sony 2015 Annual Report Download - page 201
Download and view the complete annual report
Please find page 201 of the 2015 Sony annual report below. You can navigate through the pages in the report by either clicking on the pages listed below, or by using the keyword search tool below to find specific information within the annual report.-
 1
1 -
2
-
3
-
4
-
5
-
6
-
7
-
8
-
9
-
10
-
11
-
12
-
13
-
14
-
15
-
16
-
17
-
18
-
19
-
20
-
21
-
22
-
23
-
24
-
25
-
26
-
27
-
28
-
29
-
30
-
31
-
32
-
33
-
34
-
35
-
36
-
37
-
38
-
39
-
40
-
41
-
42
-
43
-
44
-
45
-
46
-
47
-
48
-
49
-
50
-
51
-
52
-
53
-
54
-
55
-
56
-
57
-
58
-
59
-
60
-
61
-
62
-
63
-
64
-
65
-
66
-
67
-
68
-
69
-
70
-
71
-
72
-
73
-
74
-
75
-
76
-
77
-
78
-
79
-
80
-
81
-
82
-
83
-
84
-
85
-
86
-
87
-
88
-
89
-
90
-
91
-
92
-
93
-
94
-
95
-
96
-
97
-
98
-
99
-
100
-
101
-
102
-
103
-
104
-
105
-
106
-
107
-
108
-
109
-
110
-
111
-
112
-
113
-
114
-
115
-
116
-
117
-
118
-
119
-
120
-
121
-
122
-
123
-
124
-
125
-
126
-
127
-
128
-
129
-
130
-
131
-
132
-
133
-
134
-
135
-
136
-
137
-
138
-
139
-
140
-
141
-
142
-
143
-
144
-
145
-
146
-
147
-
148
-
149
-
150
-
151
-
152
-
153
-
154
-
155
-
156
-
157
-
158
-
159
-
160
-
161
-
162
-
163
-
164
-
165
-
166
-
167
-
168
-
169
-
170
-
171
-
172
-
173
-
174
-
175
-
176
-
177
-
178
-
179
-
180
-
181
-
182
-
183
-
184
-
185
-
186
-
187
-
188
-
189
-
190
-
 191
191 -
 192
192 -
 193
193 -
 194
194 -
 195
195 -
 196
196 -
 197
197 -
 198
198 -
 199
199 -
 200
200 -
 201
201 -
 202
202 -
 203
203 -
 204
204 -
 205
205 -
 206
206 -
 207
207 -
 208
208 -
 209
209 -
 210
210 -
 211
211 -
212
-
213
-
214
-
215
-
216
-
217
-
218
-
219
-
220
-
221
-
222
-
223
-
224
-
225
-
226
-
227
-
228
-
229
-
230
-
231
-
232
 |
 |

SONY CORPORATION AND CONSOLIDATED SUBSIDIARIES
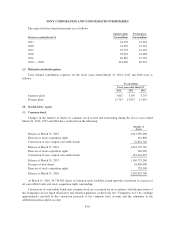
(4) Equity transactions with noncontrolling interests
Net income (loss) attributable to Sony Corporation’s stockholders and transfers (to) from the noncontrolling
interests for the fiscal years ended March 31, 2014, 2015 and 2016 were as follows:
Yen in millions
Fiscal year ended March 31
2014 2015 2016
Net income (loss) attributable to Sony Corporation’s stockholders (128,369) (125,980) 147,791
Transfers (to) from the noncontrolling interests:
Decrease in additional paid-in capital for purchase of additional shares
in consolidated subsidiaries 28 (2,483) (12,776)
Change from net income (loss) attributable to Sony Corporation’s
stockholders and transfers (to) from the noncontrolling interests (128,341) (128,463) 135,015
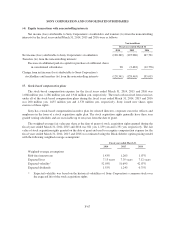
17. Stock-based compensation plans
The stock-based compensation expense for the fiscal years ended March 31, 2014, 2015 and 2016 was
1,068 million yen, 1,286 million yen and 1,944 million yen, respectively. The total cash received from exercises
under all of the stock-based compensation plans during the fiscal years ended March 31, 2014, 2015 and 2016
was 200 million yen, 1,637 million yen and 1,578 million yen, respectively. Sony issued new shares upon
exercise of these rights.
Sony has a stock-based compensation incentive plan for selected directors, corporate executive officers and
employees in the form of a stock acquisition rights plan. The stock acquisition rights generally have three year
graded vesting schedules and are exercisable up to ten years from the date of grant.
The weighted-average fair value per share at the date of grant of stock acquisition rights granted during the
fiscal years ended March 31, 2014, 2015 and 2016 was 821 yen, 1,139 yen and 1,331 yen, respectively. The fair
value of stock acquisition rights granted on the date of grant and used to recognize compensation expense for the
fiscal years ended March 31, 2014, 2015 and 2016 was estimated using the Black-Scholes option-pricing model
with the following weighted-average assumptions:
Fiscal year ended March 31
2014 2015 2016
Weighted-average assumptions
Risk-free interest rate 1.43% 1.26% 1.07%
Expected lives 7.13 years 7.35 years 7.12 years
Expected volatility*52.03% 51.69% 42.07%
Expected dividends 1.55% 1.24% 0.75%
* Expected volatility was based on the historical volatilities of Sony Corporation’s common stock over
the expected life of the stock acquisition rights.
F-67