Sony 2015 Annual Report Download - page 206
Download and view the complete annual report
Please find page 206 of the 2015 Sony annual report below. You can navigate through the pages in the report by either clicking on the pages listed below, or by using the keyword search tool below to find specific information within the annual report.-
 1
1 -
2
-
3
-
4
-
5
-
6
-
7
-
8
-
9
-
10
-
11
-
12
-
13
-
14
-
15
-
16
-
17
-
18
-
19
-
20
-
21
-
22
-
23
-
24
-
25
-
26
-
27
-
28
-
29
-
30
-
31
-
32
-
33
-
34
-
35
-
36
-
37
-
38
-
39
-
40
-
41
-
42
-
43
-
44
-
45
-
46
-
47
-
48
-
49
-
50
-
51
-
52
-
53
-
54
-
55
-
56
-
57
-
58
-
59
-
60
-
61
-
62
-
63
-
64
-
65
-
66
-
67
-
68
-
69
-
70
-
71
-
72
-
73
-
74
-
75
-
76
-
77
-
78
-
79
-
80
-
81
-
82
-
83
-
84
-
85
-
86
-
87
-
88
-
89
-
90
-
91
-
92
-
93
-
94
-
95
-
96
-
97
-
98
-
99
-
100
-
101
-
102
-
103
-
104
-
105
-
106
-
107
-
108
-
109
-
110
-
111
-
112
-
113
-
114
-
115
-
116
-
117
-
118
-
119
-
120
-
121
-
122
-
123
-
124
-
125
-
126
-
127
-
128
-
129
-
130
-
131
-
132
-
133
-
134
-
135
-
136
-
137
-
138
-
139
-
140
-
141
-
142
-
143
-
144
-
145
-
146
-
147
-
148
-
149
-
150
-
151
-
152
-
153
-
154
-
155
-
156
-
157
-
158
-
159
-
160
-
161
-
162
-
163
-
164
-
165
-
166
-
167
-
168
-
169
-
170
-
171
-
172
-
173
-
174
-
175
-
176
-
177
-
178
-
179
-
180
-
181
-
182
-
183
-
184
-
185
-
186
-
187
-
188
-
189
-
190
-
191
-
192
-
193
-
194
-
195
-
 196
196 -
 197
197 -
 198
198 -
 199
199 -
 200
200 -
 201
201 -
 202
202 -
 203
203 -
 204
204 -
 205
205 -
 206
206 -
 207
207 -
 208
208 -
 209
209 -
 210
210 -
 211
211 -
 212
212 -
 213
213 -
 214
214 -
 215
215 -
 216
216 -
217
-
218
-
219
-
220
-
221
-
222
-
223
-
224
-
225
-
226
-
227
-
228
-
229
-
230
-
231
-
232
 |
 |

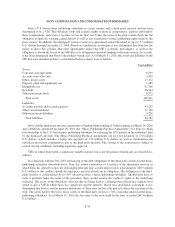
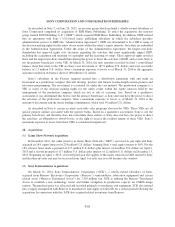
SONY CORPORATION AND CONSOLIDATED SUBSIDIARIES
All Other and Corporate
Sony recorded restructuring charges resulting from exiting the PC business of 40,850 million yen and
19,635 million yen during the fiscal years ended March 31, 2014 and 2015, respectively. The amount for the
fiscal year ended March 31, 2014 includes impairment losses of 12,817 million yen for long-lived assets and
expenses of 8,019 million yen to compensate suppliers for unused components. The amounts above also include
costs relating to a reduction in the scale of sales companies resulting from the decision to exit the PC business of
12,819 million yen and 8,278 million yen, for the fiscal years ended March 31, 2014 and 2015, respectively.
Refer to Note 25.
In an effort to improve the performance of the disc manufacturing business, Sony initiated a number of
restructuring activities to reduce its operating costs. These activities resulted in restructuring charges primarily
consisting of headcount reductions and the closure and consolidation of manufacturing sites totaling
6,923 million yen for the fiscal year ended March 31, 2015. Refer to Note 13 for the long-lived assets
impairments related to the disc manufacturing business other than restructuring charges.
As a result of efforts to optimize the sales and headquarters functions that indirectly support the Electronics
businesses, which are described above, Sony recorded restructuring charges primarily consisting of headcount
reductions totaling 22,345 million yen and 7,112 million yen during the fiscal years ended March 31, 2015 and
2016.
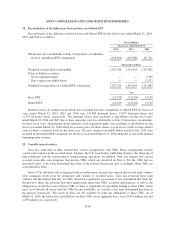
20. Supplemental consolidated statements of income information
(1) Other operating expense, net
Sony records transactions in other operating expense, net due to either the nature of the transaction or in
consideration of factors including the relationship to Sony’s core operations.
Other operating expense, net is comprised of the following:
Yen in millions
March 31
2014 2015 2016
Gain on sale of the U.S. headquarters building*1 (5,462) (5,991) (6,545)
Gain on sale of Sony City Osaki*1 (4,914) (4,914) (4,914)
Gain on sales of music publishing catalog in Pictures segment (10,307) (1,871) —
(Gain) loss on sale, remeasurement, and issuance of M3 shares*2 (13,758) 113 (2)
(Gain) loss on purchase/sale of interests in subsidiaries and affiliates, net*3 (7,753) 1,716 (31,778)
(Gain) loss on sale, disposal or impairment of assets, net*4 90,860 192,605 90,410
48,666 181,658 47,171
*1 A portion of gain on sale and leaseback transactions is deferred and is amortized on a straight-line basis over
the lease term.
*2 Refer to Note 5.
*3 Refer to Notes 24 and 25.
*4 Refer to Notes 9, 13, 19 and 25.
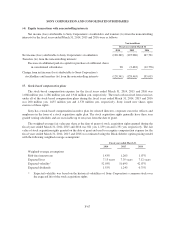
(2) Research and development costs
Research and development costs charged to cost of sales for the fiscal years ended March 31, 2014, 2015
and 2016 were 466,030 million yen, 464,320 million yen and 468,183 million yen, respectively.
F-72