Sony 2015 Annual Report Download - page 222
Download and view the complete annual report
Please find page 222 of the 2015 Sony annual report below. You can navigate through the pages in the report by either clicking on the pages listed below, or by using the keyword search tool below to find specific information within the annual report.-
 1
1 -
2
-
3
-
4
-
5
-
6
-
7
-
8
-
9
-
10
-
11
-
12
-
13
-
14
-
15
-
16
-
17
-
18
-
19
-
20
-
21
-
22
-
23
-
24
-
25
-
26
-
27
-
28
-
29
-
30
-
31
-
32
-
33
-
34
-
35
-
36
-
37
-
38
-
39
-
40
-
41
-
42
-
43
-
44
-
45
-
46
-
47
-
48
-
49
-
50
-
51
-
52
-
53
-
54
-
55
-
56
-
57
-
58
-
59
-
60
-
61
-
62
-
63
-
64
-
65
-
66
-
67
-
68
-
69
-
70
-
71
-
72
-
73
-
74
-
75
-
76
-
77
-
78
-
79
-
80
-
81
-
82
-
83
-
84
-
85
-
86
-
87
-
88
-
89
-
90
-
91
-
92
-
93
-
94
-
95
-
96
-
97
-
98
-
99
-
100
-
101
-
102
-
103
-
104
-
105
-
106
-
107
-
108
-
109
-
110
-
111
-
112
-
113
-
114
-
115
-
116
-
117
-
118
-
119
-
120
-
121
-
122
-
123
-
124
-
125
-
126
-
127
-
128
-
129
-
130
-
131
-
132
-
133
-
134
-
135
-
136
-
137
-
138
-
139
-
140
-
141
-
142
-
143
-
144
-
145
-
146
-
147
-
148
-
149
-
150
-
151
-
152
-
153
-
154
-
155
-
156
-
157
-
158
-
159
-
160
-
161
-
162
-
163
-
164
-
165
-
166
-
167
-
168
-
169
-
170
-
171
-
172
-
173
-
174
-
175
-
176
-
177
-
178
-
179
-
180
-
181
-
182
-
183
-
184
-
185
-
186
-
187
-
188
-
189
-
190
-
191
-
192
-
193
-
194
-
195
-
196
-
197
-
198
-
199
-
200
-
201
-
202
-
203
-
204
-
205
-
206
-
207
-
208
-
209
-
210
-
211
-
 212
212 -
 213
213 -
 214
214 -
 215
215 -
 216
216 -
 217
217 -
 218
218 -
 219
219 -
 220
220 -
 221
221 -
 222
222 -
 223
223 -
 224
224 -
 225
225 -
 226
226 -
 227
227 -
 228
228 -
 229
229 -
 230
230 -
 231
231 -
 232
232
 |
 |

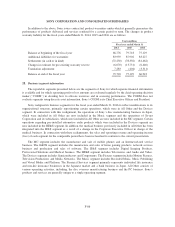
SONY CORPORATION AND CONSOLIDATED SUBSIDIARIES
Segment profit or loss:
Yen in millions
Fiscal year ended March 31
2014 2015 2016
Operating income (loss):
Mobile Communications 8,721 (217,574) (61,435)
Game & Network Services (18,845) 48,104 88,668
Imaging Products & Solutions 12,201 41,779 72,134
Home Entertainment & Sound (20,982) 24,102 50,558
Devices (16,937) 89,031 (28,580)
Pictures 51,619 58,527 38,507
Music 52,406 60,604 87,323
Financial Services 170,292 193,307 156,543
All Other (120,245) (94,977) 2,009
Total 118,230 202,903 405,727
Corporate and elimination (91,735) (134,355) (111,530)
Consolidated operating income 26,495 68,548 294,197
Other income 42,453 25,076 66,849
Other expenses (43,207) (53,895) (56,542)
Consolidated income before income taxes 25,741 39,729 304,504
Operating income (loss) is sales and operating revenue less costs and expenses, and includes equity in net
income (loss) of affiliated companies.
All Other includes the results of the PC business and the disc manufacturing business (Refer to Notes 13
and 25). For the fiscal year ended March 31, 2015, the PC business results include sales company fixed costs
which were allocated based on historical results.
Corporate and elimination includes headquarters restructuring costs, restructuring costs related to the
reduction in scale of sales companies following the decision to exit from the PC business (Refer to Notes 19
and 25), and certain other corporate expenses, including the amortization of certain intellectual property assets
such as the cross-licensing of intangible assets acquired from Ericsson at the time of the Sony Mobile
Communications acquisition, which are not allocated to segments.
Within the HE&S segment, the operating income (loss) of Televisions, which primarily consists of LCD
televisions, for the fiscal years ended March 31, 2014, 2015 and 2016 were (25,705) million yen, 8,286 million
yen and 25,812 million yen, respectively. The operating income (loss) of Televisions excludes restructuring
charges which are included in the overall segment results and are not allocated to product categories.
F-88