Sony 2015 Annual Report Download - page 63
Download and view the complete annual report
Please find page 63 of the 2015 Sony annual report below. You can navigate through the pages in the report by either clicking on the pages listed below, or by using the keyword search tool below to find specific information within the annual report.-
 1
1 -
2
-
3
-
4
-
5
-
6
-
7
-
8
-
9
-
10
-
11
-
12
-
13
-
14
-
15
-
16
-
17
-
18
-
19
-
20
-
21
-
22
-
23
-
24
-
25
-
26
-
27
-
28
-
29
-
30
-
31
-
32
-
33
-
34
-
35
-
36
-
37
-
38
-
39
-
40
-
41
-
42
-
43
-
44
-
45
-
46
-
47
-
48
-
49
-
50
-
51
-
52
-
 53
53 -
 54
54 -
 55
55 -
 56
56 -
 57
57 -
 58
58 -
 59
59 -
 60
60 -
 61
61 -
 62
62 -
 63
63 -
 64
64 -
 65
65 -
 66
66 -
 67
67 -
 68
68 -
 69
69 -
 70
70 -
 71
71 -
 72
72 -
 73
73 -
74
-
75
-
76
-
77
-
78
-
79
-
80
-
81
-
82
-
83
-
84
-
85
-
86
-
87
-
88
-
89
-
90
-
91
-
92
-
93
-
94
-
95
-
96
-
97
-
98
-
99
-
100
-
101
-
102
-
103
-
104
-
105
-
106
-
107
-
108
-
109
-
110
-
111
-
112
-
113
-
114
-
115
-
116
-
117
-
118
-
119
-
120
-
121
-
122
-
123
-
124
-
125
-
126
-
127
-
128
-
129
-
130
-
131
-
132
-
133
-
134
-
135
-
136
-
137
-
138
-
139
-
140
-
141
-
142
-
143
-
144
-
145
-
146
-
147
-
148
-
149
-
150
-
151
-
152
-
153
-
154
-
155
-
156
-
157
-
158
-
159
-
160
-
161
-
162
-
163
-
164
-
165
-
166
-
167
-
168
-
169
-
170
-
171
-
172
-
173
-
174
-
175
-
176
-
177
-
178
-
179
-
180
-
181
-
182
-
183
-
184
-
185
-
186
-
187
-
188
-
189
-
190
-
191
-
192
-
193
-
194
-
195
-
196
-
197
-
198
-
199
-
200
-
201
-
202
-
203
-
204
-
205
-
206
-
207
-
208
-
209
-
210
-
211
-
212
-
213
-
214
-
215
-
216
-
217
-
218
-
219
-
220
-
221
-
222
-
223
-
224
-
225
-
226
-
227
-
228
-
229
-
230
-
231
-
232
 |
 |
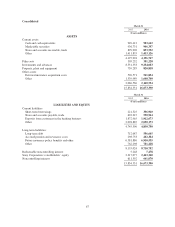
Liabilities
Total current and long-term liabilities as of March 31, 2016 increased by 640.9 billion yen, or 5.0 percent
year-on-year, to 13,541.5 billion yen. Total current and long-term liabilities as of March 31, 2016 in all
segments, excluding the Financial Services segment, decreased by 45.8 billion yen, or 1.1 percent year-on-year,
to 4,047.7 billion yen. Total current and long-term liabilities in the Financial Services segment as of March 31,
2016 increased by 688.0 billion yen, or 7.8 percent year-on-year, to 9,528.7 billion yen.
Current Liabilities
Current liabilities as of March 31, 2016 increased by 85.2 billion yen, or 1.8 percent year-on-year, to
4,830.8 billion yen.
Current liabilities as of March 31, 2016 in all segments, excluding the Financial Services segment,
decreased by 42.9 billion yen, or 1.6 percent year-on-year, to 2,626.5 billion yen.
Short-term borrowings and the current portion of long-term debt as of March 31, 2016 in all segments,
excluding the Financial Services segment, increased by 28.4 billion yen, or 13.2 percent year-on-year, to
243.5 billion yen.
Notes and accounts payable, trade as of March 31, 2016 in all segments, excluding the Financial Services
segment, decreased by 71.3 billion yen, or 11.5 percent year-on-year, to 551.0 billion yen. This decrease was
primarily due to a decrease in notes and accounts payable, trade in the MC segment.
Current liabilities as of March 31, 2016 in the Financial Services segment increased by 130.8 billion yen, or
6.3 percent year-on-year, to 2,209.2 billion yen.
Long-term Liabilities
Long-term liabilities as of March 31, 2016 increased by 555.7 billion yen, or 6.8 percent year-on-year, to
8,710.8 billion yen.
Long-term liabilities as of March 31, 2016 in all segments, excluding the Financial Services segment,
decreased by 2.9 billion yen, or 0.2 percent year-on-year, to 1,421.1 billion yen. Long-term debt as of March 31,
2016 in all segments, excluding the Financial Services segment, decreased by 145.6 billion yen, or 21.7 percent
year-on-year, to 525.5 billion yen. This decrease was primarily due to the repayment of straight bonds and bank
loans, partially offset by issuance of convertible bonds with stock acquisition rights during the fiscal year ended
March 31, 2016.
Long-term liabilities as of March 31, 2016 in the Financial Services segment increased by 557.2 billion yen,
or 8.2 percent year-on-year, to 7,319.5 billion yen. This increase was primarily due to an increase in future
insurance policy benefits resulting from the increase in the policy amount in force at Sony Life.
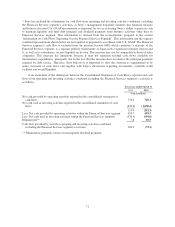
Total Interest-bearing Debt
Total interest-bearing debt inclusive of long-term debt and short-term borrowings as of March 31, 2016
decreased by 40.1 billion yen, or 4.3 percent year-on-year, to 893.5 billion yen. Total interest-bearing debt as of
March 31, 2016 in all segments, excluding the Financial Services segment, decreased by 117.2 billion yen, or
13.2 percent year-on-year, to 769.1 billion yen.
Redeemable Noncontrolling Interest
Redeemable noncontrolling interest as of March 31, 2016 increased by 2.2 billion yen, or 42.5 percent year-
on-year, to 7.5 billion yen.
63