Sony 2015 Annual Report Download - page 74
Download and view the complete annual report
Please find page 74 of the 2015 Sony annual report below. You can navigate through the pages in the report by either clicking on the pages listed below, or by using the keyword search tool below to find specific information within the annual report.-
 1
1 -
2
-
3
-
4
-
5
-
6
-
7
-
8
-
9
-
10
-
11
-
12
-
13
-
14
-
15
-
16
-
17
-
18
-
19
-
20
-
21
-
22
-
23
-
24
-
25
-
26
-
27
-
28
-
29
-
30
-
31
-
32
-
33
-
34
-
35
-
36
-
37
-
38
-
39
-
40
-
41
-
42
-
43
-
44
-
45
-
46
-
47
-
48
-
49
-
50
-
51
-
52
-
53
-
54
-
55
-
56
-
57
-
58
-
59
-
60
-
61
-
62
-
63
-
 64
64 -
 65
65 -
 66
66 -
 67
67 -
 68
68 -
 69
69 -
 70
70 -
 71
71 -
 72
72 -
 73
73 -
 74
74 -
 75
75 -
 76
76 -
 77
77 -
 78
78 -
 79
79 -
 80
80 -
 81
81 -
 82
82 -
 83
83 -
 84
84 -
85
-
86
-
87
-
88
-
89
-
90
-
91
-
92
-
93
-
94
-
95
-
96
-
97
-
98
-
99
-
100
-
101
-
102
-
103
-
104
-
105
-
106
-
107
-
108
-
109
-
110
-
111
-
112
-
113
-
114
-
115
-
116
-
117
-
118
-
119
-
120
-
121
-
122
-
123
-
124
-
125
-
126
-
127
-
128
-
129
-
130
-
131
-
132
-
133
-
134
-
135
-
136
-
137
-
138
-
139
-
140
-
141
-
142
-
143
-
144
-
145
-
146
-
147
-
148
-
149
-
150
-
151
-
152
-
153
-
154
-
155
-
156
-
157
-
158
-
159
-
160
-
161
-
162
-
163
-
164
-
165
-
166
-
167
-
168
-
169
-
170
-
171
-
172
-
173
-
174
-
175
-
176
-
177
-
178
-
179
-
180
-
181
-
182
-
183
-
184
-
185
-
186
-
187
-
188
-
189
-
190
-
191
-
192
-
193
-
194
-
195
-
196
-
197
-
198
-
199
-
200
-
201
-
202
-
203
-
204
-
205
-
206
-
207
-
208
-
209
-
210
-
211
-
212
-
213
-
214
-
215
-
216
-
217
-
218
-
219
-
220
-
221
-
222
-
223
-
224
-
225
-
226
-
227
-
228
-
229
-
230
-
231
-
232
 |
 |

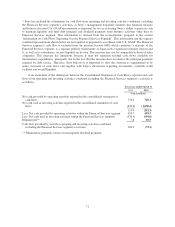
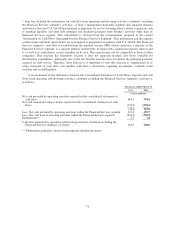
* Sony has included the information for cash flow from operating and investing activities combined, excluding
the Financial Services segment’s activities, as Sony’s management frequently monitors this financial measure
and believes this non-U.S. GAAP measurement is important for use in evaluating Sony’s ability to generate cash
to maintain liquidity and fund debt principal and dividend payments from business activities other than its
Financial Services segment. This information is derived from the reconciliations prepared in the section
“Information on Cash Flows Separating Out the Financial Services Segment”. This information and the separate
condensed presentations shown below are not required or prepared in accordance with U.S. GAAP. The Financial
Services segment’s cash flow is excluded from the measure because SFH, which constitutes a majority of the
Financial Services segment, is a separate publicly traded entity in Japan with a significant minority interest and
it, as well as its subsidiaries, secures liquidity on its own. This measure may not be comparable to those of other
companies. This measure has limitations because it does not represent residual cash flows available for
discretionary expenditures, principally due to the fact that the measure does not deduct the principal payments
required for debt service. Therefore, Sony believes it is important to view this measure as supplemental to its
entire statement of cash flows and together with Sony’s disclosures regarding investments, available credit
facilities and overall liquidity.
A reconciliation of the differences between the Consolidated Statement of Cash Flows reported and cash
flows from operating and investing activities combined excluding the Financial Services segment’s activities is
as follows:
Fiscal year ended March 31
2014 2015
(Yen in billions)
Net cash provided by operating activities reported in the consolidated statements of
cash flows 664.1 754.6
Net cash used in investing activities reported in the consolidated statements of cash
flows (710.5) (639.6)
(46.4) 115.0
Less: Net cash provided by operating activities within the Financial Services segment 413.6 459.7
Less: Net cash used in investing activities within the Financial Services segment (616.2) (536.9)
Eliminations** 6.7 7.8
Cash flow generated by operating and investing activities combined excluding the
Financial Services segment’s activities 162.9 200.0
** Eliminations primarily consist of intersegment dividend payments
74