Sony 2015 Annual Report Download - page 47
Download and view the complete annual report
Please find page 47 of the 2015 Sony annual report below. You can navigate through the pages in the report by either clicking on the pages listed below, or by using the keyword search tool below to find specific information within the annual report.-
 1
1 -
2
-
3
-
4
-
5
-
6
-
7
-
8
-
9
-
10
-
11
-
12
-
13
-
14
-
15
-
16
-
17
-
18
-
19
-
20
-
21
-
22
-
23
-
24
-
25
-
26
-
27
-
28
-
29
-
30
-
31
-
32
-
33
-
34
-
35
-
36
-
 37
37 -
 38
38 -
 39
39 -
 40
40 -
 41
41 -
 42
42 -
 43
43 -
 44
44 -
 45
45 -
 46
46 -
 47
47 -
 48
48 -
 49
49 -
 50
50 -
 51
51 -
 52
52 -
 53
53 -
 54
54 -
 55
55 -
 56
56 -
 57
57 -
58
-
59
-
60
-
61
-
62
-
63
-
64
-
65
-
66
-
67
-
68
-
69
-
70
-
71
-
72
-
73
-
74
-
75
-
76
-
77
-
78
-
79
-
80
-
81
-
82
-
83
-
84
-
85
-
86
-
87
-
88
-
89
-
90
-
91
-
92
-
93
-
94
-
95
-
96
-
97
-
98
-
99
-
100
-
101
-
102
-
103
-
104
-
105
-
106
-
107
-
108
-
109
-
110
-
111
-
112
-
113
-
114
-
115
-
116
-
117
-
118
-
119
-
120
-
121
-
122
-
123
-
124
-
125
-
126
-
127
-
128
-
129
-
130
-
131
-
132
-
133
-
134
-
135
-
136
-
137
-
138
-
139
-
140
-
141
-
142
-
143
-
144
-
145
-
146
-
147
-
148
-
149
-
150
-
151
-
152
-
153
-
154
-
155
-
156
-
157
-
158
-
159
-
160
-
161
-
162
-
163
-
164
-
165
-
166
-
167
-
168
-
169
-
170
-
171
-
172
-
173
-
174
-
175
-
176
-
177
-
178
-
179
-
180
-
181
-
182
-
183
-
184
-
185
-
186
-
187
-
188
-
189
-
190
-
191
-
192
-
193
-
194
-
195
-
196
-
197
-
198
-
199
-
200
-
201
-
202
-
203
-
204
-
205
-
206
-
207
-
208
-
209
-
210
-
211
-
212
-
213
-
214
-
215
-
216
-
217
-
218
-
219
-
220
-
221
-
222
-
223
-
224
-
225
-
226
-
227
-
228
-
229
-
230
-
231
-
232
 |
 |

Basic net loss per share as well as diluted net loss per share, attributable to Sony Corporation’s stockholders
for the fiscal year ended March 31, 2015 was 113.04 yen, compared with 124.99 yen in the fiscal year ended
March 31, 2014. Refer to Note 22 of the consolidated financial statements.
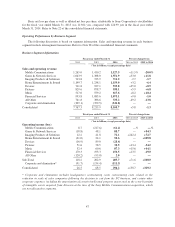
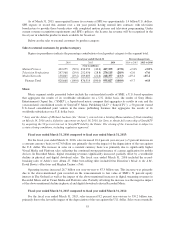
Operating Performance by Business Segment
The following discussion is based on segment information. Sales and operating revenue in each business
segment include intersegment transactions. Refer to Note 28 of the consolidated financial statements.
Business Segment Information
Fiscal year ended March 31 Percent change from
2014 2015 2016 2014 to 2015 2015 to 2016
(Yen in billions, except percentage data)
Sales and operating revenue
Mobile Communications 1,265.0 1,410.2 1,127.5 +11.5% -20.0%
Game & Network Services 1,043.9 1,388.0 1,551.9 +33.0 +11.8
Imaging Products & Solutions 743.8 723.9 711.2 -2.7 -1.7
Home Entertainment & Sound 1,199.7 1,238.1 1,159.0 +3.2 -6.4
Devices 741.8 927.1 935.8 +25.0 +0.9
Pictures 829.6 878.7 938.1 +5.9 +6.8
Music 517.0 559.2 617.6 +8.2 +10.4
Financial Services 993.8 1,083.6 1,073.1 +9.0 -1.0
All Other 761.8 386.6 333.2 -49.2 -13.8
Corporate and elimination (329.1) (379.5) (341.8) ——
Consolidated 7,767.3 8,215.9 8,105.7 +5.8 -1.3
Fiscal year ended March 31 Percent change from
2014 2015 2016 2014 to 2015 2015 to 2016
(Yen in billions, except percentage data)
Operating income (loss)
Mobile Communications 8.7 (217.6) (61.4) —% —%
Game & Network Services (18.8) 48.1 88.7 —+84.3
Imaging Products & Solutions 12.2 41.8 72.1 +242.4 +72.7
Home Entertainment & Sound (21.0) 24.1 50.6 —+109.8
Devices (16.9) 89.0 (28.6) ——
Pictures 51.6 58.5 38.5 +13.4 -34.2
Music 52.4 60.6 87.3 +15.6 +44.1
Financial Services 170.3 193.3 156.5 +13.5 -19.0
All Other (120.2) (95.0) 2.0 ——
Sub-Total 118.2 202.9 405.7 +71.6 +100.0
Corporate and elimination* (91.7) (134.4) (111.5) ——
Consolidated 26.5 68.5 294.2 +158.7 +329.2
* Corporate and elimination includes headquarters restructuring costs, restructuring costs related to the
reduction in scale of sales companies following the decision to exit from the PC business, and certain other
corporate expenses, including the amortization of certain intellectual property assets such as the cross-licensing
of intangible assets acquired from Ericsson at the time of the Sony Mobile Communications acquisition, which
are not allocated to segments.
47