Sony 2015 Annual Report Download - page 78
Download and view the complete annual report
Please find page 78 of the 2015 Sony annual report below. You can navigate through the pages in the report by either clicking on the pages listed below, or by using the keyword search tool below to find specific information within the annual report.-
 1
1 -
2
-
3
-
4
-
5
-
6
-
7
-
8
-
9
-
10
-
11
-
12
-
13
-
14
-
15
-
16
-
17
-
18
-
19
-
20
-
21
-
22
-
23
-
24
-
25
-
26
-
27
-
28
-
29
-
30
-
31
-
32
-
33
-
34
-
35
-
36
-
37
-
38
-
39
-
40
-
41
-
42
-
43
-
44
-
45
-
46
-
47
-
48
-
49
-
50
-
51
-
52
-
53
-
54
-
55
-
56
-
57
-
58
-
59
-
60
-
61
-
62
-
63
-
64
-
65
-
66
-
67
-
 68
68 -
 69
69 -
 70
70 -
 71
71 -
 72
72 -
 73
73 -
 74
74 -
 75
75 -
 76
76 -
 77
77 -
 78
78 -
 79
79 -
 80
80 -
 81
81 -
 82
82 -
 83
83 -
 84
84 -
 85
85 -
 86
86 -
 87
87 -
 88
88 -
89
-
90
-
91
-
92
-
93
-
94
-
95
-
96
-
97
-
98
-
99
-
100
-
101
-
102
-
103
-
104
-
105
-
106
-
107
-
108
-
109
-
110
-
111
-
112
-
113
-
114
-
115
-
116
-
117
-
118
-
119
-
120
-
121
-
122
-
123
-
124
-
125
-
126
-
127
-
128
-
129
-
130
-
131
-
132
-
133
-
134
-
135
-
136
-
137
-
138
-
139
-
140
-
141
-
142
-
143
-
144
-
145
-
146
-
147
-
148
-
149
-
150
-
151
-
152
-
153
-
154
-
155
-
156
-
157
-
158
-
159
-
160
-
161
-
162
-
163
-
164
-
165
-
166
-
167
-
168
-
169
-
170
-
171
-
172
-
173
-
174
-
175
-
176
-
177
-
178
-
179
-
180
-
181
-
182
-
183
-
184
-
185
-
186
-
187
-
188
-
189
-
190
-
191
-
192
-
193
-
194
-
195
-
196
-
197
-
198
-
199
-
200
-
201
-
202
-
203
-
204
-
205
-
206
-
207
-
208
-
209
-
210
-
211
-
212
-
213
-
214
-
215
-
216
-
217
-
218
-
219
-
220
-
221
-
222
-
223
-
224
-
225
-
226
-
227
-
228
-
229
-
230
-
231
-
232
 |
 |

Research and development is focused in four key domains which are essential for product differentiation
and for creating value-added products: a common development platform technology for home and mobile
electronics, semiconductor, device, and software technologies.
Research and development costs for the fiscal year ended March 31, 2016 were essentially flat year-on-year
at 468.2 billion yen. This was primarily due to an increase in research and development costs in the Devices
segment, reflecting an increase in image sensor-related research and development costs, substantially offset by a
decrease in research and development costs in the MC, IP&S and HE&S segments, each categorized as either a
“stable profit generator” or an “area focusing on volatility management” (refer to Trend Information in
Item 5 D). This decrease was a result of the strategic decision not to pursue scale in order to improve
profitability, which accelerated cost control initiatives to address the decrease in scale of Sony’s AV/IT
electronics businesses. The ratio of research and development costs to sales (which excludes Financial Services
segment revenue) increased from 6.5 percent to 6.7 percent.
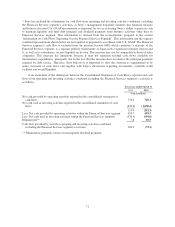
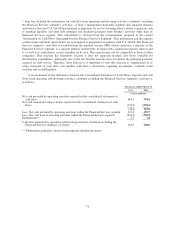
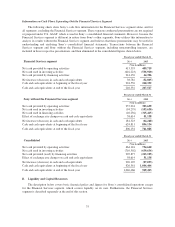
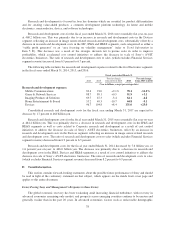
The following table includes the research and development expenses related to the five Electronics segments
in the fiscal years ended March 31, 2014, 2015, and 2016.
Fiscal year ended March 31
2014 2015
Percent change
from 2014 to 2015 2016
Percent change
from 2015 to 2016
(Yen in billions, except percentage data)
Research and development expenses
Mobile Communications 83.4 91.0 +9.1% 78.1 -14.2%
Game & Network Services 88.7 89.1 +0.5 91.9 +3.1
Imaging Products & Solutions 69.7 67.3 -3.4 64.1 -4.8
Home Entertainment & Sound 55.2 49.3 -10.7 44.8 -9.1
Devices 96.7 104.8 +8.4 131.0 +25.0
Consolidated research and development costs for the fiscal year ending March 31, 2017 are expected to
decrease by 1.7 percent to 460 billion yen.
Research and development costs for the fiscal year ended March 31, 2015 were essentially flat year-on-year
at 464.4 billion yen. This was primarily due to a decrease in research and development costs in the IP&S and
HE&S segments as well as costs related to Corporate research and development as a result of cost control
initiatives to address the decrease in scale of Sony’s AV/IT electronics businesses, offset by an increase in
research and development costs in the Devices segment, reflecting an increase in image sensor-related research
and development costs. The ratio of research and development costs to sales (which excludes Financial Services
segment revenue) decreased from 6.9 percent to 6.5 percent.
Research and development costs for the fiscal year ended March 31, 2014 decreased by 7.6 billion yen, or
1.6 percent year-on-year, to 466.0 billion yen. The decrease was primarily due to a decrease in research and
development costs in the IP&S, Devices and HE&S segments as a result of cost control initiatives to address the
decrease in scale of Sony’s AV/IT electronics businesses. The ratio of research and development costs to sales
(which excludes Financial Services segment revenue) decreased from 8.2 percent to 6.9 percent.
D. Trend Information
This section contains forward-looking statements about the possible future performance of Sony and should
be read in light of the cautionary statement on that subject, which appears on the inside front cover page and
applies to this entire document.
Issues Facing Sony and Management’s Response to those Issues
The global economic recovery has been weakening amid increasing financial turbulence, with recovery in
advanced economies remaining only modest, and prospects across emerging countries continue to be uneven and
generally weaker than in the past 20 years. In advanced economies, factors such as unfavorable demographic
78