Sony 2015 Annual Report Download - page 49
Download and view the complete annual report
Please find page 49 of the 2015 Sony annual report below. You can navigate through the pages in the report by either clicking on the pages listed below, or by using the keyword search tool below to find specific information within the annual report.-
 1
1 -
2
-
3
-
4
-
5
-
6
-
7
-
8
-
9
-
10
-
11
-
12
-
13
-
14
-
15
-
16
-
17
-
18
-
19
-
20
-
21
-
22
-
23
-
24
-
25
-
26
-
27
-
28
-
29
-
30
-
31
-
32
-
33
-
34
-
35
-
36
-
37
-
38
-
 39
39 -
 40
40 -
 41
41 -
 42
42 -
 43
43 -
 44
44 -
 45
45 -
 46
46 -
 47
47 -
 48
48 -
 49
49 -
 50
50 -
 51
51 -
 52
52 -
 53
53 -
 54
54 -
 55
55 -
 56
56 -
 57
57 -
 58
58 -
 59
59 -
60
-
61
-
62
-
63
-
64
-
65
-
66
-
67
-
68
-
69
-
70
-
71
-
72
-
73
-
74
-
75
-
76
-
77
-
78
-
79
-
80
-
81
-
82
-
83
-
84
-
85
-
86
-
87
-
88
-
89
-
90
-
91
-
92
-
93
-
94
-
95
-
96
-
97
-
98
-
99
-
100
-
101
-
102
-
103
-
104
-
105
-
106
-
107
-
108
-
109
-
110
-
111
-
112
-
113
-
114
-
115
-
116
-
117
-
118
-
119
-
120
-
121
-
122
-
123
-
124
-
125
-
126
-
127
-
128
-
129
-
130
-
131
-
132
-
133
-
134
-
135
-
136
-
137
-
138
-
139
-
140
-
141
-
142
-
143
-
144
-
145
-
146
-
147
-
148
-
149
-
150
-
151
-
152
-
153
-
154
-
155
-
156
-
157
-
158
-
159
-
160
-
161
-
162
-
163
-
164
-
165
-
166
-
167
-
168
-
169
-
170
-
171
-
172
-
173
-
174
-
175
-
176
-
177
-
178
-
179
-
180
-
181
-
182
-
183
-
184
-
185
-
186
-
187
-
188
-
189
-
190
-
191
-
192
-
193
-
194
-
195
-
196
-
197
-
198
-
199
-
200
-
201
-
202
-
203
-
204
-
205
-
206
-
207
-
208
-
209
-
210
-
211
-
212
-
213
-
214
-
215
-
216
-
217
-
218
-
219
-
220
-
221
-
222
-
223
-
224
-
225
-
226
-
227
-
228
-
229
-
230
-
231
-
232
 |
 |

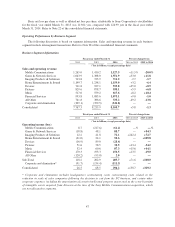
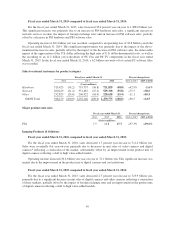
Fiscal year ended March 31, 2015 compared to fiscal year ended March 31, 2014:
For the fiscal year ended March 31, 2015, sales increased 33.0 percent year-on-year to 1,388.0 billion yen.
This significant increase was primarily due to an increase in PS4 hardware unit sales, a significant increase in
network services revenue, the impact of foreign exchange rates and an increase in PS4 software sales, partially
offset by a decrease in PS3 hardware and PS3 software sales.
Operating income of 48.1 billion yen was recorded, compared to an operating loss of 18.8 billion yen in the
fiscal year ended March 31, 2014. This significant improvement was primarily due to the impact of the above-
mentioned increase in sales, partially offset by the impact of the decrease in PS3 software sales, the unfavorable
impact of the appreciation of the U.S. dollar reflecting the high ratio of U.S. dollar-denominated costs, as well as
the recording of an 11.2 billion yen write-down of PS Vita and PS TV components in the fiscal year ended
March 31, 2015. In the fiscal year ended March 31, 2014, a 6.2 billion yen write-off of certain PC software titles
was recorded.
Sales to external customers by product category
Fiscal year ended March 31 Percent change from
2014 2015 2016 2014 to 2015 2015 to 2016
(Yen in millions)
Hardware 513,425 (54.2) 733,757 (56.8) 721,829 (48.8) +42.9% -1.6%
Network 200,229 (21.2) 351,467 (27.2) 529,318 (35.8) +75.5 +50.6
Other 232,825 (24.6) 206,922 (16.0) 228,628 (15.4) -11.1 +10.5
G&NS Total 946,479 (100.0) 1,292,146 (100.0) 1,479,775 (100.0) +36.5 +14.5
Major product unit sales
Fiscal year ended March 31 Percent change from
2014 2015 2016 2014 to 2015 2015 to 2016
(Units in millions)
PS4 7.5 14.8 17.7 +97.3% +19.6%
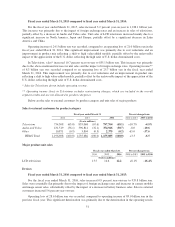
Imaging Products & Solutions
Fiscal year ended March 31, 2016 compared to fiscal year ended March 31, 2015:
For the fiscal year ended March 31, 2016, sales decreased 1.7 percent year-on-year to 711.2 billion yen.
Sales were essentially flat year-on-year primarily due to decreases in unit sales of video cameras and digital
cameras* reflecting a contraction of the market, substantially offset by an improvement in the product mix of
digital cameras reflecting a shift to high value-added models.
Operating income increased 30.4 billion yen year-on-year to 72.1 billion yen. This significant increase was
mainly due to the improvement in the product mix of digital cameras and cost reductions.
Fiscal year ended March 31, 2015 compared to fiscal year ended March 31, 2014:
For the fiscal year ended March 31, 2015, sales decreased 2.7 percent year-on-year to 723.9 billion yen,
primarily due to a significant decrease in unit sales of digital cameras and video cameras reflecting a contraction
of these markets, partially offset by the impact of foreign exchange rates and an improvement in the product mix
of digital cameras reflecting a shift to high value-added models.
49