Sony 2015 Annual Report Download - page 43
Download and view the complete annual report
Please find page 43 of the 2015 Sony annual report below. You can navigate through the pages in the report by either clicking on the pages listed below, or by using the keyword search tool below to find specific information within the annual report.-
 1
1 -
2
-
3
-
4
-
5
-
6
-
7
-
8
-
9
-
10
-
11
-
12
-
13
-
14
-
15
-
16
-
17
-
18
-
19
-
20
-
21
-
22
-
23
-
24
-
25
-
26
-
27
-
28
-
29
-
30
-
31
-
32
-
 33
33 -
 34
34 -
 35
35 -
 36
36 -
 37
37 -
 38
38 -
 39
39 -
 40
40 -
 41
41 -
 42
42 -
 43
43 -
 44
44 -
 45
45 -
 46
46 -
 47
47 -
 48
48 -
 49
49 -
 50
50 -
 51
51 -
 52
52 -
 53
53 -
54
-
55
-
56
-
57
-
58
-
59
-
60
-
61
-
62
-
63
-
64
-
65
-
66
-
67
-
68
-
69
-
70
-
71
-
72
-
73
-
74
-
75
-
76
-
77
-
78
-
79
-
80
-
81
-
82
-
83
-
84
-
85
-
86
-
87
-
88
-
89
-
90
-
91
-
92
-
93
-
94
-
95
-
96
-
97
-
98
-
99
-
100
-
101
-
102
-
103
-
104
-
105
-
106
-
107
-
108
-
109
-
110
-
111
-
112
-
113
-
114
-
115
-
116
-
117
-
118
-
119
-
120
-
121
-
122
-
123
-
124
-
125
-
126
-
127
-
128
-
129
-
130
-
131
-
132
-
133
-
134
-
135
-
136
-
137
-
138
-
139
-
140
-
141
-
142
-
143
-
144
-
145
-
146
-
147
-
148
-
149
-
150
-
151
-
152
-
153
-
154
-
155
-
156
-
157
-
158
-
159
-
160
-
161
-
162
-
163
-
164
-
165
-
166
-
167
-
168
-
169
-
170
-
171
-
172
-
173
-
174
-
175
-
176
-
177
-
178
-
179
-
180
-
181
-
182
-
183
-
184
-
185
-
186
-
187
-
188
-
189
-
190
-
191
-
192
-
193
-
194
-
195
-
196
-
197
-
198
-
199
-
200
-
201
-
202
-
203
-
204
-
205
-
206
-
207
-
208
-
209
-
210
-
211
-
212
-
213
-
214
-
215
-
216
-
217
-
218
-
219
-
220
-
221
-
222
-
223
-
224
-
225
-
226
-
227
-
228
-
229
-
230
-
231
-
232
 |
 |
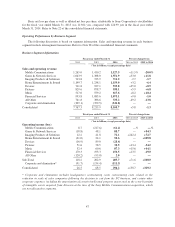
Cost of Sales, Selling, General and Administrative Expenses and Other Operating Expense, net
“Sales” in the analysis of the ratio of “cost of sales” to sales, the ratio of “research and development costs”
to sales, and the ratio of “selling, general and administrative expenses (“SGA expenses”)” to sales refers only to
the “net sales” and “other operating revenue” portions of consolidated sales (which excludes financial services
revenue). This is because “financial services expenses” are recorded separately from cost of sales and SGA
expenses in the consolidated financial statements. The calculations of all ratios below that pertain to reportable
segments include intersegment transactions.
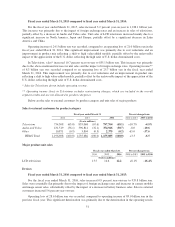
Fiscal year ended March 31, 2016 compared to fiscal year ended March 31, 2015:
For the fiscal year ended March 31, 2016, cost of sales decreased by 108.3 billion yen, or 2.1 percent year-
on-year, to 5,166.9 billion yen. Cost of sales in the fiscal year ended March 31, 2015 included an 11.2 billion yen
write-down of PlayStation®Vita (“PS Vita”) and PlayStation TV (“PS TV”) components in the G&NS segment.
The ratio of cost of sales to sales improved year-on-year from 73.9 percent to 73.4 percent.
Research and development costs (all research and development costs are included within cost of sales)
increased by 3.9 billion yen, or 0.8 percent year-on-year, to 468.2 billion yen. The ratio of research and
development costs to sales was 6.7 percent compared to 6.5 percent in the fiscal year ended March 31, 2015.
SGA expenses decreased by 119.5 billion yen, or 6.6 percent year-on-year, to 1,691.9 billion yen, mainly
due to decreases in advertising costs and restructuring charges. The ratio of SGA expenses to sales improved
year-on-year from 25.4 percent to 24.0 percent.
Other operating expense, net was 47.2 billion yen, a decrease of 134.5 billion yen, or 74.0 percent year-on-
year. This significant improvement was mainly due to a decrease in the amount of impairment charges. Other
operating expense, net for the fiscal year ended March 31, 2016 included a 59.6 billion yen impairment charge
against long-lived assets in the camera module business and a 30.6 billion yen impairment charge against long-
lived assets in the battery business, both of which were recorded in the Devices segment, as well as a 151 million
U.S. dollars (18.1 billion yen) gain recorded in the Music segment on the remeasurement to fair value of Sony
Music Entertainment’s (“SME”) 51 percent equity interest in Orchard Media, Inc. (“The Orchard”), which had
previously been accounted for under the equity method, as a result of SME increasing its ownership interest to
100 percent. It also included a gain of 12.3 billion yen from the sale of a part of the logistics business, in
connection with the formation of a logistics joint venture, recorded in Corporate and elimination. Other
Operating expense, net for the fiscal year ended March 31, 2015 included a 176.0 billion yen impairment charge
against goodwill recorded in the MC segment and a gain of 14.8 billion yen recognized on the sale of certain
buildings and premises at the Gotenyama Technology Center in Japan, recorded in Corporate and elimination.
Refer to Note 20 of the consolidated financial statements.
Fiscal year ended March 31, 2015 compared to fiscal year ended March 31, 2014:
For the fiscal year ended March 31, 2015, cost of sales increased by 135.1 billion yen, or 2.6 percent year-
on-year, to 5,275.1 billion yen. This increase included an 11.2 billion yen write-down of PS Vita and PS TV
components in the G&NS segment. The ratio of cost of sales to sales improved year-on-year from 75.8 percent to
73.9 percent.
Research and development costs (all research and development costs are included within cost of sales)
decreased by 1.7 billion yen, or 0.4 percent year-on-year, to 464.3 billion yen. The ratio of research and
development costs to sales was 6.5 percent compared to 6.9 percent in the fiscal year ended March 31, 2014.
SGA expenses increased by 82.9 billion yen, or 4.8 percent year-on-year, to 1,811.5 billion yen, mainly due
to the impact of the depreciation of the yen, partially offset by a decrease in personnel costs due to the impact of
restructuring initiatives. The ratio of SGA expenses to sales was essentially flat at 25.4 percent, compared to
25.5 percent in the fiscal year ended March 31, 2014.
43