Sony 2015 Annual Report Download - page 54
Download and view the complete annual report
Please find page 54 of the 2015 Sony annual report below. You can navigate through the pages in the report by either clicking on the pages listed below, or by using the keyword search tool below to find specific information within the annual report.-
 1
1 -
2
-
3
-
4
-
5
-
6
-
7
-
8
-
9
-
10
-
11
-
12
-
13
-
14
-
15
-
16
-
17
-
18
-
19
-
20
-
21
-
22
-
23
-
24
-
25
-
26
-
27
-
28
-
29
-
30
-
31
-
32
-
33
-
34
-
35
-
36
-
37
-
38
-
39
-
40
-
41
-
42
-
43
-
 44
44 -
 45
45 -
 46
46 -
 47
47 -
 48
48 -
 49
49 -
 50
50 -
 51
51 -
 52
52 -
 53
53 -
 54
54 -
 55
55 -
 56
56 -
 57
57 -
 58
58 -
 59
59 -
 60
60 -
 61
61 -
 62
62 -
 63
63 -
 64
64 -
65
-
66
-
67
-
68
-
69
-
70
-
71
-
72
-
73
-
74
-
75
-
76
-
77
-
78
-
79
-
80
-
81
-
82
-
83
-
84
-
85
-
86
-
87
-
88
-
89
-
90
-
91
-
92
-
93
-
94
-
95
-
96
-
97
-
98
-
99
-
100
-
101
-
102
-
103
-
104
-
105
-
106
-
107
-
108
-
109
-
110
-
111
-
112
-
113
-
114
-
115
-
116
-
117
-
118
-
119
-
120
-
121
-
122
-
123
-
124
-
125
-
126
-
127
-
128
-
129
-
130
-
131
-
132
-
133
-
134
-
135
-
136
-
137
-
138
-
139
-
140
-
141
-
142
-
143
-
144
-
145
-
146
-
147
-
148
-
149
-
150
-
151
-
152
-
153
-
154
-
155
-
156
-
157
-
158
-
159
-
160
-
161
-
162
-
163
-
164
-
165
-
166
-
167
-
168
-
169
-
170
-
171
-
172
-
173
-
174
-
175
-
176
-
177
-
178
-
179
-
180
-
181
-
182
-
183
-
184
-
185
-
186
-
187
-
188
-
189
-
190
-
191
-
192
-
193
-
194
-
195
-
196
-
197
-
198
-
199
-
200
-
201
-
202
-
203
-
204
-
205
-
206
-
207
-
208
-
209
-
210
-
211
-
212
-
213
-
214
-
215
-
216
-
217
-
218
-
219
-
220
-
221
-
222
-
223
-
224
-
225
-
226
-
227
-
228
-
229
-
230
-
231
-
232
 |
 |
Pictures
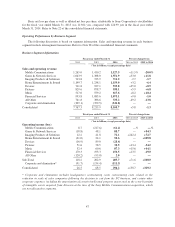
Pictures segment results presented below are a yen-translation of the results of Sony Pictures Entertainment
(“SPE”), a U.S.-based operation that aggregates the results of its worldwide subsidiaries on a U.S. dollar basis.
Management analyzes the results of SPE in U.S. dollars, so discussion of certain portions of its results is
specified as being on “a U.S. dollar basis.”
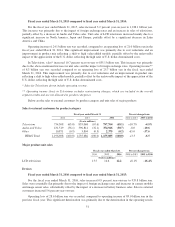
Fiscal year ended March 31, 2016 compared to fiscal year ended March 31, 2015:
For the fiscal year ended March 31, 2016, sales increased 6.8 percent year-on-year (essentially flat on a U.S.
dollar basis) to 938.1 billion yen. On a U.S. dollar basis, the impact of foreign exchange rates as well as lower
sales in Motion Pictures were substantially offset by higher sales in Media Networks and Television
Productions. The decrease in Motion Pictures sales was primarily due to a decrease in home entertainment
revenues as the previous fiscal year benefited from the strong home entertainment performances of The Amazing
Spider-Man 2,22 Jump Street and Heaven Is For Real. Partially offsetting the decrease in home entertainment
revenues was higher theatrical revenues in the fiscal year ended March 31, 2016, driven by the strong worldwide
theatrical performances of Spectre and Hotel Transylvania 2. The increase in Media Networks sales was
primarily due to higher advertising revenues in India and the United Kingdom. The increase in Television
Productions sales was primarily due to higher subscription video-on-demand (“SVOD”) revenues for Breaking
Bad,The Blacklist and Better Call Saul.
Operating income decreased 20.0 billion yen year-on-year to 38.5 billion yen. This decrease was primarily
due to the impact of the above-mentioned lower home entertainment revenues, the underperformance of The
Walk and The Brothers Grimsby, and the negative impact of foreign exchange rates. This decrease was partially
offset by the above-mentioned impact of higher Media Networks sales in India and the United Kingdom and the
worldwide theatrical performance of Hotel Transylvania 2.
As of March 31, 2016, unrecognized license fee revenue at SPE was approximately 1.9 billion U.S. dollars.
SPE expects to record this amount over a ten-year period, having entered into contracts with television
broadcasters to provide those broadcasters with completed motion pictures and television programming. Under
current revenue recognition requirements and SPE’s policies, the license fee revenue will be recognized in the
fiscal year in which the product is made available for broadcast.
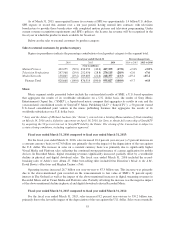
Fiscal year ended March 31, 2015 compared to fiscal year ended March 31, 2014:
For the fiscal year ended March 31, 2015, sales increased 5.9 percent year-on-year to 878.7 billion yen due to
the favorable impact of the depreciation of the yen against the U.S. dollar. On a U.S. dollar basis, sales for the fiscal
year ended March 31, 2015 decreased approximately 4 percent year-on-year primarily due to a decrease in sales for
Motion Pictures and Television Productions. The decrease in Motion Pictures sales was primarily due to lower
theatrical revenues reflecting fewer theatrical releases as compared to the fiscal year ended March 31, 2014. The
decrease in Television Productions sales was due to the fiscal year ended March 31, 2014 benefitting from the
extension and expansion in scope of a licensing agreement for game shows produced by SPE, including Wheel of
Fortune. Sales for Media Networks increased year-on-year due to higher digital game revenues and advertising
revenues primarily due to acquisitions made in the fiscal years ended March 31, 2015 and March 31, 2014.
Operating income increased by 6.9 billion yen year-on-year to 58.5 billion yen, primarily due to the
favorable impact of the depreciation of the yen against the U.S. dollar. On a U.S. dollar basis, operating income
was essentially flat year-on-year. The fiscal year ended March 31, 2015 benefitted from the stronger year-on-year
performance of the film slate because the fiscal year ended March 31, 2014 reflected the underperformance of
White House Down and After Earth. The fiscal year ended March 31, 2015 also benefitted from lower
restructuring charges. Partially offsetting this increase was a gain recognized on the sale of SPE’s music
publishing catalog in the fiscal year ended March 31, 2014, the above-mentioned decrease in Television
Productions sales and higher programming and marketing costs for SPE’s television networks in India. The fiscal
year ended March 31, 2015 also included approximately 41 million U.S. dollars (4.9 billion yen) in costs,
primarily for investigation and remediation activities, relating to a cyber-attack on SPE’s network and
IT infrastructure which was identified in the fiscal year ended March 31, 2015 (“the cyber-attack”).
54