Sony 2015 Annual Report Download - page 86
Download and view the complete annual report
Please find page 86 of the 2015 Sony annual report below. You can navigate through the pages in the report by either clicking on the pages listed below, or by using the keyword search tool below to find specific information within the annual report.-
 1
1 -
2
-
3
-
4
-
5
-
6
-
7
-
8
-
9
-
10
-
11
-
12
-
13
-
14
-
15
-
16
-
17
-
18
-
19
-
20
-
21
-
22
-
23
-
24
-
25
-
26
-
27
-
28
-
29
-
30
-
31
-
32
-
33
-
34
-
35
-
36
-
37
-
38
-
39
-
40
-
41
-
42
-
43
-
44
-
45
-
46
-
47
-
48
-
49
-
50
-
51
-
52
-
53
-
54
-
55
-
56
-
57
-
58
-
59
-
60
-
61
-
62
-
63
-
64
-
65
-
66
-
67
-
68
-
69
-
70
-
71
-
72
-
73
-
74
-
75
-
 76
76 -
 77
77 -
 78
78 -
 79
79 -
 80
80 -
 81
81 -
 82
82 -
 83
83 -
 84
84 -
 85
85 -
 86
86 -
 87
87 -
 88
88 -
 89
89 -
 90
90 -
 91
91 -
 92
92 -
 93
93 -
 94
94 -
 95
95 -
 96
96 -
97
-
98
-
99
-
100
-
101
-
102
-
103
-
104
-
105
-
106
-
107
-
108
-
109
-
110
-
111
-
112
-
113
-
114
-
115
-
116
-
117
-
118
-
119
-
120
-
121
-
122
-
123
-
124
-
125
-
126
-
127
-
128
-
129
-
130
-
131
-
132
-
133
-
134
-
135
-
136
-
137
-
138
-
139
-
140
-
141
-
142
-
143
-
144
-
145
-
146
-
147
-
148
-
149
-
150
-
151
-
152
-
153
-
154
-
155
-
156
-
157
-
158
-
159
-
160
-
161
-
162
-
163
-
164
-
165
-
166
-
167
-
168
-
169
-
170
-
171
-
172
-
173
-
174
-
175
-
176
-
177
-
178
-
179
-
180
-
181
-
182
-
183
-
184
-
185
-
186
-
187
-
188
-
189
-
190
-
191
-
192
-
193
-
194
-
195
-
196
-
197
-
198
-
199
-
200
-
201
-
202
-
203
-
204
-
205
-
206
-
207
-
208
-
209
-
210
-
211
-
212
-
213
-
214
-
215
-
216
-
217
-
218
-
219
-
220
-
221
-
222
-
223
-
224
-
225
-
226
-
227
-
228
-
229
-
230
-
231
-
232
 |
 |

To determine the benefit obligation of the Japanese pension plans, Sony used a discount rate of 0.6 percent
for its Japanese pension plans as of March 31, 2016. The discount rate was determined by using information
about yields on high-quality bonds currently available and expected to be available during the period to maturity
of the pension benefit obligation in consideration of amounts and timing of cash outflows for expected benefit
payments. Such available information about yields is collected from published market information and credit
rating agencies. The 0.6 percent discount rate represents a 40 basis point decrease from the 1.0 percent discount
rate used for the fiscal year ended March 31, 2015 and reflects current Japanese market interest conditions.
To determine the expected long-term rate of return on pension plan assets, Sony considers the current and
expected asset allocations, as well as historical and expected long-term rates of return on various categories of
pension plan assets. Sony’s pension investment policy recognizes the expected growth and the variability risk
associated with the long-term nature of pension liabilities, the returns and risks of diversification across asset
classes, and the correlation among assets. The asset allocations are designed to maximize returns consistent with
levels of liquidity and investment risk that are considered prudent and reasonable. While the pension investment
policy gives appropriate consideration to recent market performance and historical returns, the investment
assumptions utilized by Sony are designed to achieve a long-term return consistent with the long-term nature of
the corresponding pension liabilities. For Japanese pension plans, the expected long-term rate of return on
pension plan assets was 3.0 percent as of March 31, 2015 and 2016. The actual return on pension plan assets for
the fiscal years ended March 31, 2015 and 2016 was an 11.4 percent gain and an 1.3 percent loss, respectively.
The difference between the expected and the actual rate of return on pension plan assets was primarily due to the
negative performance especially in the global equity markets throughout the fiscal year ended March 31, 2016
and the depreciation of foreign currency-denominated assets reflecting the increase in the strength of the yen.
Actual results that differ from the expected return on pension plan assets are accumulated and amortized as a
component of pension costs over the average future service period, thereby reducing the year-to-year volatility in
pension costs. As of March 31, 2015 and 2016, Sony had, with respect to Japanese pension plans, net actuarial
losses of 218.5 billion yen and 389.3 billion yen, respectively, including losses related to pension plan assets. For
the fiscal year ended March 31, 2016, the net actuarial loss increased due to the decline in the discount rate used
to determine the defined benefit obligation, as compared to the prior fiscal year’s rate, and the lower actual return
on pension plan assets than expected.
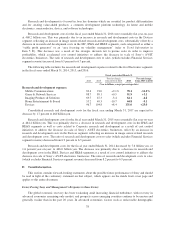
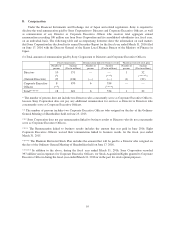
The following table illustrates the effect on the fiscal year ending March 31, 2017 of changes in the discount
rate and the expected return on pension plan assets, while holding all other assumptions as of March 31, 2016
constant, for Japanese pension plans.
Change in assumption
Projected benefit
obligations
Pension
costs Net income
(Yen in billions)
25 basis point increase / decrease in discount rate -/+41.5 -/+1.9 +/-1.3
25 basis point increase / decrease in expected long-term rate of return on
pension plan assets — -/+1.7 +/-1.1
Deferred tax asset valuation
Carrying amounts of deferred tax assets require a reduction by a valuation allowance if, based on the
available evidence, it is more likely than not that such assets will not be realized prior to expiration. Accordingly,
the need to establish a valuation allowance for deferred tax assets is assessed periodically with appropriate
consideration given to all positive and negative evidence related to the realization of the deferred tax assets.
Management’s judgments related to this assessment consider, among other matters, the nature, frequency and
severity of current and cumulative losses on an individual tax jurisdiction basis, forecasts of future profitability
after consideration of uncertain tax positions, excess of appreciated asset value over the tax basis of net assets,
the duration of statutory carryforward periods, the past utilization of net operating loss carryforwards prior to
expiration, as well as prudent and feasible tax planning strategies which would be employed by Sony to prevent
net operating loss and tax credit carryforwards from expiring unutilized.
86