Sony 2015 Annual Report Download - page 6
Download and view the complete annual report
Please find page 6 of the 2015 Sony annual report below. You can navigate through the pages in the report by either clicking on the pages listed below, or by using the keyword search tool below to find specific information within the annual report.-
 1
1 -
 2
2 -
 3
3 -
 4
4 -
 5
5 -
 6
6 -
 7
7 -
 8
8 -
 9
9 -
 10
10 -
 11
11 -
 12
12 -
 13
13 -
 14
14 -
 15
15 -
 16
16 -
 17
17 -
18
-
19
-
20
-
21
-
22
-
23
-
24
-
25
-
26
-
27
-
28
-
29
-
30
-
31
-
32
-
33
-
34
-
35
-
36
-
37
-
38
-
39
-
40
-
41
-
42
-
43
-
44
-
45
-
46
-
47
-
48
-
49
-
50
-
51
-
52
-
53
-
54
-
55
-
56
-
57
-
58
-
59
-
60
-
61
-
62
-
63
-
64
-
65
-
66
-
67
-
68
-
69
-
70
-
71
-
72
-
73
-
74
-
75
-
76
-
77
-
78
-
79
-
80
-
81
-
82
-
83
-
84
-
85
-
86
-
87
-
88
-
89
-
90
-
91
-
92
-
93
-
94
-
95
-
96
-
97
-
98
-
99
-
100
-
101
-
102
-
103
-
104
-
105
-
106
-
107
-
108
-
109
-
110
-
111
-
112
-
113
-
114
-
115
-
116
-
117
-
118
-
119
-
120
-
121
-
122
-
123
-
124
-
125
-
126
-
127
-
128
-
129
-
130
-
131
-
132
-
133
-
134
-
135
-
136
-
137
-
138
-
139
-
140
-
141
-
142
-
143
-
144
-
145
-
146
-
147
-
148
-
149
-
150
-
151
-
152
-
153
-
154
-
155
-
156
-
157
-
158
-
159
-
160
-
161
-
162
-
163
-
164
-
165
-
166
-
167
-
168
-
169
-
170
-
171
-
172
-
173
-
174
-
175
-
176
-
177
-
178
-
179
-
180
-
181
-
182
-
183
-
184
-
185
-
186
-
187
-
188
-
189
-
190
-
191
-
192
-
193
-
194
-
195
-
196
-
197
-
198
-
199
-
200
-
201
-
202
-
203
-
204
-
205
-
206
-
207
-
208
-
209
-
210
-
211
-
212
-
213
-
214
-
215
-
216
-
217
-
218
-
219
-
220
-
221
-
222
-
223
-
224
-
225
-
226
-
227
-
228
-
229
-
230
-
231
-
232
 |
 |

Item 1. Identity of Directors, Senior Management and Advisers
Not Applicable
Item 2. Offer Statistics and Expected Timetable
Not Applicable
Item 3. Key Information
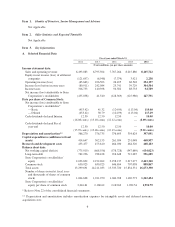
A. Selected Financial Data
Fiscal year ended March 31
2012 2013 2014 2015 2016
(Yen in millions, yen per share amounts)
Income statement data:
Sales and operating revenue 6,493,083 6,795,504 7,767,266 8,215,880 8,105,712
Equity in net income (loss) of affiliated
companies (121,697) (6,948) (7,374) 3,921 2,238
Operating income (loss) (65,663) 226,503 26,495 68,548 294,197
Income (loss) before income taxes (80,911) 242,084 25,741 39,729 304,504
Income taxes 316,753 140,398 94,582 88,733 94,789
Net income (loss) attributable to Sony
Corporation’s stockholders (455,038) 41,540 (128,369) (125,980) 147,791
Data per share of Common Stock:
Net income (loss) attributable to Sony
Corporation’s stockholders*
— Basic (453.42) 41.32 (124.99) (113.04) 119.40
— Diluted (453.42) 38.79 (124.99) (113.04) 117.49
Cash dividends declared Interim 12.50 12.50 12.50 — 10.00
(16.08 cents) (15.18 cents) (12.12 cents) — (8.09 cents)
Cash dividends declared Fiscal
year-end 12.50 12.50 12.50 — 10.00
(15.70 cents) (12.46 cents) (12.19 cents) — (9.01 cents)
Depreciation and amortization** 366,270 376,735 376,695 354,624 397,091
Capital expenditures (additions to fixed
assets) 414,647 302,153 261,034 251,048 468,937
Research and development costs 433,477 473,610 466,030 464,320 468,183
Balance sheet data:
Net working capital (deficit) (775,019) (668,556) (578,728) (547,689) (634,023)
Long-term debt 762,226 938,428 916,648 712,087 556,605
Sony Corporation’s stockholders’
equity 2,023,822 2,192,262 2,258,137 2,317,077 2,463,340
Common stock 630,923 630,923 646,654 707,038 858,867
Total assets 13,299,691 14,211,033 15,333,720 15,834,331 16,673,390
Number of shares issued at fiscal year-
end (thousands of shares of common
stock) 1,004,638 1,011,950 1,044,708 1,169,773 1,262,494
Sony Corporation’s stockholders’
equity per share of common stock 2,016.61 2,168.62 2,163.63 1,982.54 1,952.79
* Refer to Note 22 of the consolidated financial statements.
** Depreciation and amortization includes amortization expenses for intangible assets and deferred insurance
acquisition costs.
6