Sony 2015 Annual Report Download - page 166
Download and view the complete annual report
Please find page 166 of the 2015 Sony annual report below. You can navigate through the pages in the report by either clicking on the pages listed below, or by using the keyword search tool below to find specific information within the annual report.-
 1
1 -
2
-
3
-
4
-
5
-
6
-
7
-
8
-
9
-
10
-
11
-
12
-
13
-
14
-
15
-
16
-
17
-
18
-
19
-
20
-
21
-
22
-
23
-
24
-
25
-
26
-
27
-
28
-
29
-
30
-
31
-
32
-
33
-
34
-
35
-
36
-
37
-
38
-
39
-
40
-
41
-
42
-
43
-
44
-
45
-
46
-
47
-
48
-
49
-
50
-
51
-
52
-
53
-
54
-
55
-
56
-
57
-
58
-
59
-
60
-
61
-
62
-
63
-
64
-
65
-
66
-
67
-
68
-
69
-
70
-
71
-
72
-
73
-
74
-
75
-
76
-
77
-
78
-
79
-
80
-
81
-
82
-
83
-
84
-
85
-
86
-
87
-
88
-
89
-
90
-
91
-
92
-
93
-
94
-
95
-
96
-
97
-
98
-
99
-
100
-
101
-
102
-
103
-
104
-
105
-
106
-
107
-
108
-
109
-
110
-
111
-
112
-
113
-
114
-
115
-
116
-
117
-
118
-
119
-
120
-
121
-
122
-
123
-
124
-
125
-
126
-
127
-
128
-
129
-
130
-
131
-
132
-
133
-
134
-
135
-
136
-
137
-
138
-
139
-
140
-
141
-
142
-
143
-
144
-
145
-
146
-
147
-
148
-
149
-
150
-
151
-
152
-
153
-
154
-
155
-
 156
156 -
 157
157 -
 158
158 -
 159
159 -
 160
160 -
 161
161 -
 162
162 -
 163
163 -
 164
164 -
 165
165 -
 166
166 -
 167
167 -
 168
168 -
 169
169 -
 170
170 -
 171
171 -
 172
172 -
 173
173 -
 174
174 -
 175
175 -
 176
176 -
177
-
178
-
179
-
180
-
181
-
182
-
183
-
184
-
185
-
186
-
187
-
188
-
189
-
190
-
191
-
192
-
193
-
194
-
195
-
196
-
197
-
198
-
199
-
200
-
201
-
202
-
203
-
204
-
205
-
206
-
207
-
208
-
209
-
210
-
211
-
212
-
213
-
214
-
215
-
216
-
217
-
218
-
219
-
220
-
221
-
222
-
223
-
224
-
225
-
226
-
227
-
228
-
229
-
230
-
231
-
232
 |
 |

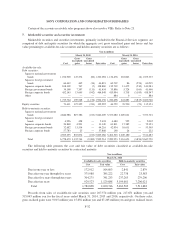
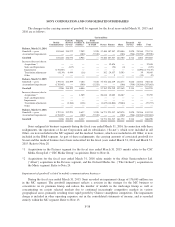
SONY CORPORATION AND CONSOLIDATED SUBSIDIARIES
Certain of the accounts receivable sales programs above also involve VIEs. Refer to Note 23.
7. Marketable securities and securities investments
Marketable securities and securities investments, primarily included in the Financial Services segment, are
comprised of debt and equity securities for which the aggregate cost, gross unrealized gains and losses and fair
value pertaining to available-for-sale securities and held-to-maturity securities are as follows:
Yen in millions
March 31, 2015 March 31, 2016
Cost
Gross
unrealized
gains
Gross
unrealized
losses Fair value Cost
Gross
unrealized
gains
Gross
unrealized
losses Fair value
Available-for-sale:
Debt securities:
Japanese national government
bonds 1,074,900 147,274 (80) 1,222,094 1,136,478 218,863 (6) 1,355,335
Japanese local government
bonds 66,442 465 (16) 66,891 60,707 86 (254) 60,539
Japanese corporate bonds 108,109 767 (7) 108,869 132,739 11,472 (230) 143,981
Foreign government bonds 34,168 7,397 (111) 41,454 35,896 5,724 (160) 41,460
Foreign corporate bonds 452,145 13,645 (942) 464,848 415,994 5,738 (3,185) 418,547
Other — — — — 884 0 — 884
1,735,764 169,548 (1,156) 1,904,156 1,782,698 241,883 (3,835) 2,020,746
Equity securities 73,411 127,322 (741) 199,992 44,752 70,590 (21) 115,321
Held-to-maturity securities:
Japanese national government
bonds 4,846,986 819,386 (103) 5,666,269 5,353,080 2,020,621 — 7,373,701
Japanese local government
bonds 4,996 428 — 5,424 4,480 522 — 5,002
Japanese corporate bonds 26,848 4,501 — 31,349 61,811 17,382 — 79,193
Foreign government bonds 32,682 11,534 — 44,216 42,934 10,631 — 53,565
Foreign corporate bonds 57,783 25 — 57,808 198 24 — 222
4,969,295 835,874 (103) 5,805,066 5,462,503 2,049,180 — 7,511,683
Total 6,778,470 1,132,744 (2,000) 7,909,214 7,289,953 2,361,653 (3,856) 9,647,750
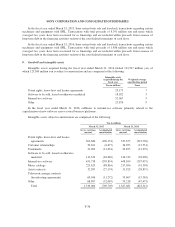
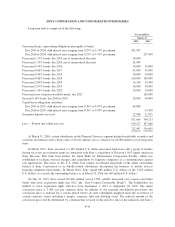
The following table presents the cost and fair value of debt securities classified as available-for-sale
securities and held-to-maturity securities by contractual maturity:
Yen in millions
March 31, 2016
Available-for-sale securities Held-to-maturity securities
Cost Fair value Cost Fair value
Due in one year or less 172,912 164,603 2,841 2,879
Due after one year through five years 375,988 385,222 22,738 23,583
Due after five years through ten years 304,275 341,233 237,263 279,200
Due after ten years 929,523 1,129,688 5,199,661 7,206,021
Total 1,782,698 2,020,746 5,462,503 7,511,683
Proceeds from sales of available-for-sale securities were 207,574 million yen, 217,651 million yen and
315,043 million yen for the fiscal years ended March 31, 2014, 2015 and 2016, respectively. On these sales,
gross realized gains were 9,015 million yen, 15,656 million yen and 67,205 million yen and gross realized losses
F-32