Sony 2015 Annual Report Download - page 217
Download and view the complete annual report
Please find page 217 of the 2015 Sony annual report below. You can navigate through the pages in the report by either clicking on the pages listed below, or by using the keyword search tool below to find specific information within the annual report.-
 1
1 -
2
-
3
-
4
-
5
-
6
-
7
-
8
-
9
-
10
-
11
-
12
-
13
-
14
-
15
-
16
-
17
-
18
-
19
-
20
-
21
-
22
-
23
-
24
-
25
-
26
-
27
-
28
-
29
-
30
-
31
-
32
-
33
-
34
-
35
-
36
-
37
-
38
-
39
-
40
-
41
-
42
-
43
-
44
-
45
-
46
-
47
-
48
-
49
-
50
-
51
-
52
-
53
-
54
-
55
-
56
-
57
-
58
-
59
-
60
-
61
-
62
-
63
-
64
-
65
-
66
-
67
-
68
-
69
-
70
-
71
-
72
-
73
-
74
-
75
-
76
-
77
-
78
-
79
-
80
-
81
-
82
-
83
-
84
-
85
-
86
-
87
-
88
-
89
-
90
-
91
-
92
-
93
-
94
-
95
-
96
-
97
-
98
-
99
-
100
-
101
-
102
-
103
-
104
-
105
-
106
-
107
-
108
-
109
-
110
-
111
-
112
-
113
-
114
-
115
-
116
-
117
-
118
-
119
-
120
-
121
-
122
-
123
-
124
-
125
-
126
-
127
-
128
-
129
-
130
-
131
-
132
-
133
-
134
-
135
-
136
-
137
-
138
-
139
-
140
-
141
-
142
-
143
-
144
-
145
-
146
-
147
-
148
-
149
-
150
-
151
-
152
-
153
-
154
-
155
-
156
-
157
-
158
-
159
-
160
-
161
-
162
-
163
-
164
-
165
-
166
-
167
-
168
-
169
-
170
-
171
-
172
-
173
-
174
-
175
-
176
-
177
-
178
-
179
-
180
-
181
-
182
-
183
-
184
-
185
-
186
-
187
-
188
-
189
-
190
-
191
-
192
-
193
-
194
-
195
-
196
-
197
-
198
-
199
-
200
-
201
-
202
-
203
-
204
-
205
-
206
-
 207
207 -
 208
208 -
 209
209 -
 210
210 -
 211
211 -
 212
212 -
 213
213 -
 214
214 -
 215
215 -
 216
216 -
 217
217 -
 218
218 -
 219
219 -
 220
220 -
 221
221 -
 222
222 -
 223
223 -
 224
224 -
 225
225 -
 226
226 -
 227
227 -
228
-
229
-
230
-
231
-
232
 |
 |
SONY CORPORATION AND CONSOLIDATED SUBSIDIARIES
(3) Sale of the logistics business
On April 1, 2015, in connection with the formation of a logistics joint venture, Sony sold a part of its
logistics business in Japan, Thailand, and Malaysia within Corporate to MITSUI-SOKO HOLDINGS Co., Ltd.
for a sales price of 19,211 million yen. As a result of the sale, Sony recognized a gain of 12,284 million yen in
other operating expense, net in the consolidated statement of income.
26. Collaborative arrangements
Sony’s collaborative arrangements primarily relate to arrangements entered into, through a subsidiary in the
Pictures segment, with one or more active participants to jointly finance, produce and/or distribute motion
pictures or television programming under which both the subsidiary and the other active participants share in the
risks and rewards of ownership. These arrangements are referred to as co-production and distribution
arrangements.
Sony typically records an asset for only the portion of the motion pictures or television programming it
owns and finances. Sony and the other participants typically distribute the product in different media or
markets. Revenues earned and expenses incurred for the media or markets in which Sony distributes the product
are typically recorded on a gross basis. Sony typically does not record revenues earned and expenses incurred
when the other participants distribute the product. Sony and the other participants typically share in the profits
from the distribution of the product in all media or markets. For motion pictures, if Sony is a net receiver of
(1) Sony’s share of the profits from the media or markets distributed by the other participants less (2) the other
participants’ share of the profits from the media or markets distributed by Sony then the net amount is recorded
as net sales. If Sony is a net payer then the net amount is recorded in cost of sales. For television programming,
Sony records its share of the profits from the media or markets distributed by the other participants as sales, and
the other participants’ share of the profits from the media or markets distributed by Sony as cost of sales.
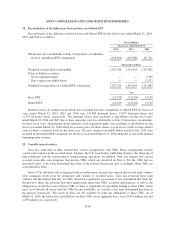
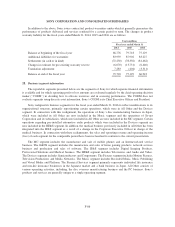
For the years ended March 31, 2014, 2015 and 2016, 17,291 million yen, 23,741 million yen and
30,888 million yen, respectively, were recorded as net sales for amounts due from the other participants and
16,359 million yen, 22,983 million yen and 38,303 million yen, respectively, were recorded as cost of sales for
amounts owed to the other participants in these collaborative arrangements.
27. Commitments, contingent liabilities and other
(1) Loan commitments
Subsidiaries in the Financial Services segment have entered into loan agreements with their customers in
accordance with the condition of the contracts. As of March 31, 2016, the total unused portion of the lines of
credit extended under these contracts was 30,611 million yen. The aggregate amounts of future year-by-year
payments for these loan commitments cannot be determined.
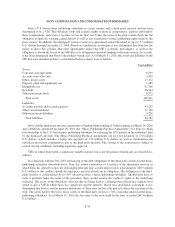
(2) Purchase commitments and other
Purchase commitments and other outstanding as of March 31, 2016 amounted to 420,250 million yen. The
major components of these commitments are as follows:
Certain subsidiaries in the Pictures segment have entered into agreements with creative talent for the
development and production of motion pictures and television programming as well as agreements with third parties
to acquire completed motion pictures, or certain rights therein, and to acquire the rights to broadcast certain live
action sporting events. These agreements cover various periods mainly within three years. As of March 31, 2016,
these subsidiaries were committed to make payments under such contracts of 138,586 million yen.
As discussed in Note 23 and under the Guarantees section below, a subsidiary in the Music segment has
entered into the Music Publishing Purchase Agreements with the third-party investor to obtain full ownership of
F-83