Sony 2015 Annual Report Download - page 179
Download and view the complete annual report
Please find page 179 of the 2015 Sony annual report below. You can navigate through the pages in the report by either clicking on the pages listed below, or by using the keyword search tool below to find specific information within the annual report.-
 1
1 -
2
-
3
-
4
-
5
-
6
-
7
-
8
-
9
-
10
-
11
-
12
-
13
-
14
-
15
-
16
-
17
-
18
-
19
-
20
-
21
-
22
-
23
-
24
-
25
-
26
-
27
-
28
-
29
-
30
-
31
-
32
-
33
-
34
-
35
-
36
-
37
-
38
-
39
-
40
-
41
-
42
-
43
-
44
-
45
-
46
-
47
-
48
-
49
-
50
-
51
-
52
-
53
-
54
-
55
-
56
-
57
-
58
-
59
-
60
-
61
-
62
-
63
-
64
-
65
-
66
-
67
-
68
-
69
-
70
-
71
-
72
-
73
-
74
-
75
-
76
-
77
-
78
-
79
-
80
-
81
-
82
-
83
-
84
-
85
-
86
-
87
-
88
-
89
-
90
-
91
-
92
-
93
-
94
-
95
-
96
-
97
-
98
-
99
-
100
-
101
-
102
-
103
-
104
-
105
-
106
-
107
-
108
-
109
-
110
-
111
-
112
-
113
-
114
-
115
-
116
-
117
-
118
-
119
-
120
-
121
-
122
-
123
-
124
-
125
-
126
-
127
-
128
-
129
-
130
-
131
-
132
-
133
-
134
-
135
-
136
-
137
-
138
-
139
-
140
-
141
-
142
-
143
-
144
-
145
-
146
-
147
-
148
-
149
-
150
-
151
-
152
-
153
-
154
-
155
-
156
-
157
-
158
-
159
-
160
-
161
-
162
-
163
-
164
-
165
-
166
-
167
-
168
-
 169
169 -
 170
170 -
 171
171 -
 172
172 -
 173
173 -
 174
174 -
 175
175 -
 176
176 -
 177
177 -
 178
178 -
 179
179 -
 180
180 -
 181
181 -
 182
182 -
 183
183 -
 184
184 -
 185
185 -
 186
186 -
 187
187 -
 188
188 -
 189
189 -
190
-
191
-
192
-
193
-
194
-
195
-
196
-
197
-
198
-
199
-
200
-
201
-
202
-
203
-
204
-
205
-
206
-
207
-
208
-
209
-
210
-
211
-
212
-
213
-
214
-
215
-
216
-
217
-
218
-
219
-
220
-
221
-
222
-
223
-
224
-
225
-
226
-
227
-
228
-
229
-
230
-
231
-
232
 |
 |
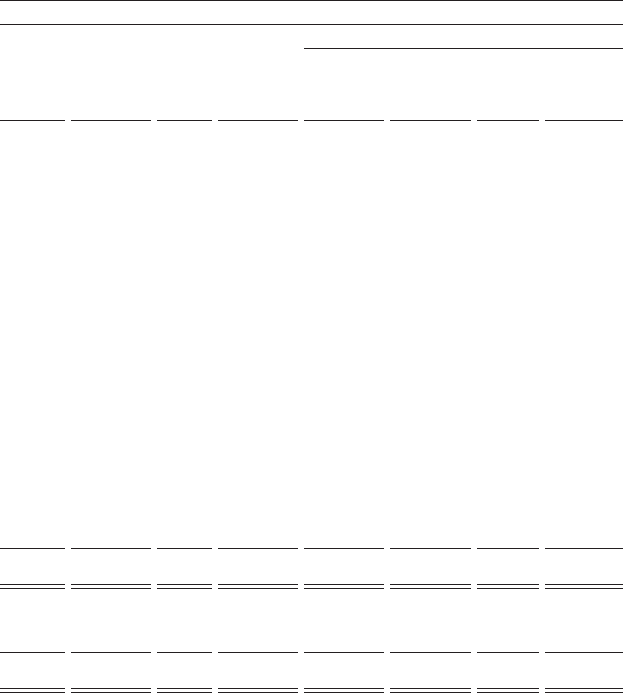
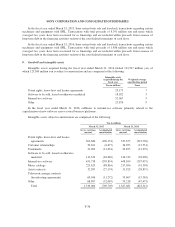
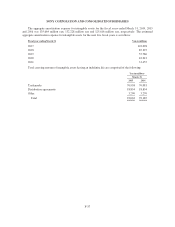
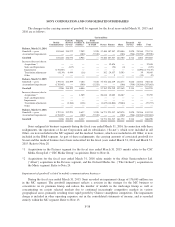
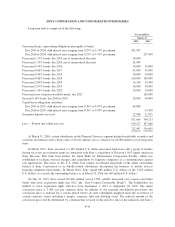
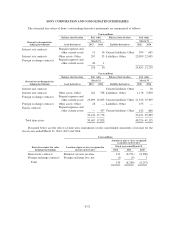
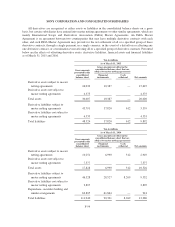
SONY CORPORATION AND CONSOLIDATED SUBSIDIARIES
Yen in millions
March 31, 2016
Presentation in the consolidated balance sheets
Level 1 Level 2 Level 3 Total
Marketable
securities
Securities
investments
and other
Other
current
assets/
liabilities
Other
noncurrent
assets/
liabilities
Assets:
Trading securities 501,448 297,793 — 799,241 799,241 — — —
Available-for-sale securities
Debt securities
Japanese national
government bonds — 1,355,335 — 1,355,335 5,084 1,350,251 — —
Japanese local government
bonds — 60,539 — 60,539 6,515 54,024 — —
Japanese corporate bonds — 140,635 3,346 143,981 5,727 138,254 — —
Foreign government bonds — 41,460 — 41,460 2,309 39,151 — —
Foreign corporate bonds — 402,694 15,853 418,547 124,680 293,867 — —
Other — — 884 884 — 884 — —
Equity securities 115,200 121 — 115,321 — 115,321 — —
Other investments*1 7,179 4,027 13,463 24,669 — 24,669 — —
Derivative assets*2 437 17,391 — 17,828 — — 17,257 571
Total assets 624,264 2,319,995 33,546 2,977,805 943,556 2,016,421 17,257 571
Liabilities:
Derivative liabilities*2 668 48,467 — 49,135 — — 20,680 28,455
Total liabilities 668 48,467 — 49,135 — — 20,680 28,455
*1 Other investments include certain hybrid financial instruments and certain private equity investments.
*2 Derivative assets and liabilities are recognized and disclosed on a gross basis.
Transfers into level 1 were 3,460 million yen and 3,556 million yen for the fiscal years ended March 31,
2015 and 2016, respectively, as quoted prices for certain trading securities and available-for-sale securities
became available in an active market. Transfers out of level 1 were 13,376 million yen and 2,716 million yen for
the fiscal years ended March 31, 2015 and 2016, respectively, as quoted prices for certain trading securities and
available-for-sale securities were not available in an active market.
F-45