Sony 2015 Annual Report Download - page 56
Download and view the complete annual report
Please find page 56 of the 2015 Sony annual report below. You can navigate through the pages in the report by either clicking on the pages listed below, or by using the keyword search tool below to find specific information within the annual report.-
 1
1 -
2
-
3
-
4
-
5
-
6
-
7
-
8
-
9
-
10
-
11
-
12
-
13
-
14
-
15
-
16
-
17
-
18
-
19
-
20
-
21
-
22
-
23
-
24
-
25
-
26
-
27
-
28
-
29
-
30
-
31
-
32
-
33
-
34
-
35
-
36
-
37
-
38
-
39
-
40
-
41
-
42
-
43
-
44
-
45
-
 46
46 -
 47
47 -
 48
48 -
 49
49 -
 50
50 -
 51
51 -
 52
52 -
 53
53 -
 54
54 -
 55
55 -
 56
56 -
 57
57 -
 58
58 -
 59
59 -
 60
60 -
 61
61 -
 62
62 -
 63
63 -
 64
64 -
 65
65 -
 66
66 -
67
-
68
-
69
-
70
-
71
-
72
-
73
-
74
-
75
-
76
-
77
-
78
-
79
-
80
-
81
-
82
-
83
-
84
-
85
-
86
-
87
-
88
-
89
-
90
-
91
-
92
-
93
-
94
-
95
-
96
-
97
-
98
-
99
-
100
-
101
-
102
-
103
-
104
-
105
-
106
-
107
-
108
-
109
-
110
-
111
-
112
-
113
-
114
-
115
-
116
-
117
-
118
-
119
-
120
-
121
-
122
-
123
-
124
-
125
-
126
-
127
-
128
-
129
-
130
-
131
-
132
-
133
-
134
-
135
-
136
-
137
-
138
-
139
-
140
-
141
-
142
-
143
-
144
-
145
-
146
-
147
-
148
-
149
-
150
-
151
-
152
-
153
-
154
-
155
-
156
-
157
-
158
-
159
-
160
-
161
-
162
-
163
-
164
-
165
-
166
-
167
-
168
-
169
-
170
-
171
-
172
-
173
-
174
-
175
-
176
-
177
-
178
-
179
-
180
-
181
-
182
-
183
-
184
-
185
-
186
-
187
-
188
-
189
-
190
-
191
-
192
-
193
-
194
-
195
-
196
-
197
-
198
-
199
-
200
-
201
-
202
-
203
-
204
-
205
-
206
-
207
-
208
-
209
-
210
-
211
-
212
-
213
-
214
-
215
-
216
-
217
-
218
-
219
-
220
-
221
-
222
-
223
-
224
-
225
-
226
-
227
-
228
-
229
-
230
-
231
-
232
 |
 |

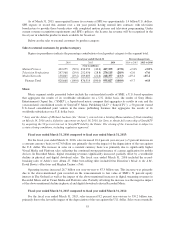
flat year-on-year on a constant currency basis primarily due to higher digital streaming revenues, offset by a
worldwide decline in physical and digital download sales. Best-selling titles included One Direction’s FOUR,
AC/DC’s Rock or Bust, Meghan Trainor’s Title, Nogizaka 46’s Toumeinairo and Michael Jackson’s XSCAPE.
Operating income increased 8.2 billion yen year-on-year to 60.6 billion yen. This increase was primarily due
to the favorable impact of the depreciation of the yen, an increase in equity in net income from affiliated
companies, mainly EMI Music Publishing, and a decrease in marketing costs.
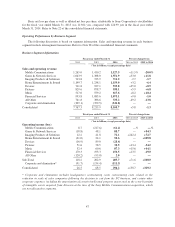
Below are the sales to external customers by product category:
Sales to external customers by product category
Figures in parentheses indicate the percentage contribution of each product category to the segment total.
Fiscal year ended March 31 Percent change from
2014 2015 2016 2014 to 2015 2015 to 2016
(Yen in millions)
Recorded Music 347,684 (69.8) 383,350 (70.9) 412,718 (68.7) +10.3% +7.7%
Music Publishing 66,869 (13.4) 70,959 (13.1) 71,258 (11.8) +6.1 +0.4
Visual Media & Platform 83,777 (16.8) 86,195 (16.0) 116,993 (19.5) +2.8 +35.7
Music Total 498,330 (100.0) 540,504 (100.0) 600,969 (100.0) +8.5 +11.2
Financial Services
In Sony’s Financial Services segment, the results include Sony Financial Holdings Inc. (“SFH”) and SFH’s
consolidated subsidiaries such as Sony Life Insurance Co., Ltd. (“Sony Life”), Sony Assurance Inc. and Sony
Bank Inc. (“Sony Bank”). The results of Sony Life discussed below on the basis of U.S. GAAP differ from the
results that SFH and Sony Life disclose separately on a Japanese statutory basis.
Fiscal year ended March 31, 2016 compared to fiscal year ended March 31, 2015:
For the fiscal year ended March 31, 2016, financial services revenue was 1,073.1 billion yen, essentially flat
year-on-year. This was primarily due to a deterioration in investment performance in the separate account at
Sony Life, driven by the deterioration in the stock market, substantially offset by an increase in insurance
premium revenue reflecting a steady increase in policy amount in force at Sony Life. Revenue at Sony Life was
952.6 billion yen, essentially flat year-on-year.
Operating income decreased 36.8 billion year-on-year to 156.5 billion yen mainly due to a decrease in
operating income at Sony Life. At Sony Life, operating income decreased 39.2 billion yen year-on-year to 138.8
billion yen, mainly due to increases in the amortization of deferred insurance acquisition costs and the provision
of policy reserves, primarily driven by a significant decrease in interest rates and the deterioration in the stock
market.
Fiscal year ended March 31, 2015 compared to fiscal year ended March 31, 2014:
For the fiscal year ended March 31, 2015, financial services revenue increased 9.0 percent year-on-year to
1,083.6 billion yen primarily due to an increase in revenue at Sony Life. Revenue at Sony Life increased
9.6 percent year-on-year to 967.1 billion yen mainly due to an improvement in investment performance in the
separate account resulting from a larger rise in the Japanese stock market in the fiscal year ended March 31, 2015
than in the fiscal year ended March 31, 2014, as well as an increase in insurance premium revenue reflecting an
increase in policy amount in force.
Operating income increased 23.0 billion yen year-on-year to 193.3 billion yen. This increase was mainly
due to an increase in operating income at Sony Life. Operating income at Sony Life increased 18.3 billion yen
year-on-year to 178.0 billion yen primarily due to an improvement in investment performance in the general
account, as well as a decrease in the provision of policy reserves pertaining to minimum guarantees for variable
insurance, driven by the above-mentioned improvement in the Japanese stock market.
56