Sony 2015 Annual Report Download - page 44
Download and view the complete annual report
Please find page 44 of the 2015 Sony annual report below. You can navigate through the pages in the report by either clicking on the pages listed below, or by using the keyword search tool below to find specific information within the annual report.-
 1
1 -
2
-
3
-
4
-
5
-
6
-
7
-
8
-
9
-
10
-
11
-
12
-
13
-
14
-
15
-
16
-
17
-
18
-
19
-
20
-
21
-
22
-
23
-
24
-
25
-
26
-
27
-
28
-
29
-
30
-
31
-
32
-
33
-
 34
34 -
 35
35 -
 36
36 -
 37
37 -
 38
38 -
 39
39 -
 40
40 -
 41
41 -
 42
42 -
 43
43 -
 44
44 -
 45
45 -
 46
46 -
 47
47 -
 48
48 -
 49
49 -
 50
50 -
 51
51 -
 52
52 -
 53
53 -
 54
54 -
55
-
56
-
57
-
58
-
59
-
60
-
61
-
62
-
63
-
64
-
65
-
66
-
67
-
68
-
69
-
70
-
71
-
72
-
73
-
74
-
75
-
76
-
77
-
78
-
79
-
80
-
81
-
82
-
83
-
84
-
85
-
86
-
87
-
88
-
89
-
90
-
91
-
92
-
93
-
94
-
95
-
96
-
97
-
98
-
99
-
100
-
101
-
102
-
103
-
104
-
105
-
106
-
107
-
108
-
109
-
110
-
111
-
112
-
113
-
114
-
115
-
116
-
117
-
118
-
119
-
120
-
121
-
122
-
123
-
124
-
125
-
126
-
127
-
128
-
129
-
130
-
131
-
132
-
133
-
134
-
135
-
136
-
137
-
138
-
139
-
140
-
141
-
142
-
143
-
144
-
145
-
146
-
147
-
148
-
149
-
150
-
151
-
152
-
153
-
154
-
155
-
156
-
157
-
158
-
159
-
160
-
161
-
162
-
163
-
164
-
165
-
166
-
167
-
168
-
169
-
170
-
171
-
172
-
173
-
174
-
175
-
176
-
177
-
178
-
179
-
180
-
181
-
182
-
183
-
184
-
185
-
186
-
187
-
188
-
189
-
190
-
191
-
192
-
193
-
194
-
195
-
196
-
197
-
198
-
199
-
200
-
201
-
202
-
203
-
204
-
205
-
206
-
207
-
208
-
209
-
210
-
211
-
212
-
213
-
214
-
215
-
216
-
217
-
218
-
219
-
220
-
221
-
222
-
223
-
224
-
225
-
226
-
227
-
228
-
229
-
230
-
231
-
232
 |
 |
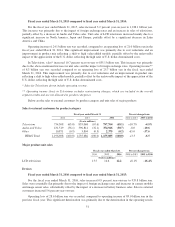
Other operating expense, net was 181.7 billion yen, an increase of 133.0 billion yen, or 273.3 percent year-
on-year. This significant deterioration was mainly due to the recording of a 176.0 billion yen charge for the
impairment of goodwill recorded in the MC segment. Sony performed its interim goodwill impairment test and
concluded that the fair value of the MC business had decreased. This deterioration was partially offset by a gain
of 14.8 billion yen recognized on the sale of certain buildings and premises at Gotenyama Technology Center in
Japan, recorded in Corporate and Elimination. Other operating expense, net for the fiscal year ended March 31,
2014 included a 32.1 billion yen impairment charge related to long-lived assets in the battery business in the
Devices segment, a 25.6 billion yen impairment charge related to long-lived assets in the disc manufacturing
business outside of Japan and the U.S. and goodwill across the entire disc manufacturing business, and a
12.8 billion yen impairment charge related to long-lived assets in the PC business, all of which were recorded in
All Other, partially offset by a gain of 12.8 billion yen from the sale of certain shares of M3, Inc. (“M3”), which
was recorded in All Other. Refer to Note 20 of the consolidated financial statements.
Equity in Net Income (Loss) of Affiliated Companies
Fiscal year ended March 31, 2016 compared to fiscal year ended March 31, 2015:
For the fiscal year ended March 31, 2016, equity in net income of affiliated companies decreased by
1.7 billion yen, or 42.9 percent year-on-year, to 2.2 billion yen. This decrease was mainly due to a deterioration
of equity in net income (loss) for Intertrust Technologies Corporation in All Other.
Fiscal year ended March 31, 2015 compared to fiscal year ended March 31, 2014:
For the fiscal year ended March 31, 2015, equity in net income of affiliated companies resulted in an income
of 3.9 billion yen, compared with a loss of 7.4 billion yen in the fiscal year ended March 31, 2014. This
improvement was mainly due to an improvement of equity in net income (loss) for Intertrust Technologies
Corporation in All Other.
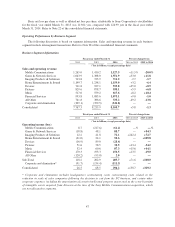
Operating Income
Fiscal year ended March 31, 2016 compared to fiscal year ended March 31, 2015:
For the fiscal year ended March 31, 2016, operating income increased by 225.6 billion yen, or 329.2 percent
year-on-year, to 294.2 billion yen. This significant increase was primarily due to significant improvements in the
results of the MC segment and All Other, as well as the G&NS, Imaging Products & Solutions (“IP&S”), Music
and Home Entertainment & Sound (“HE&S”) segments. The increase in consolidated operating income was
partially offset by a significant deterioration in the operating results of the Devices, Financial Services and
Pictures segments. Restructuring charges, net, decreased 59.8 billion yen year-on-year to 38.3 billion yen.
Fiscal year ended March 31, 2015 compared to fiscal year ended March 31, 2014:
For the fiscal year ended March 31, 2015, operating income increased 42.1 billion yen, or 158.7 percent
year-on-year, to 68.5 billion yen. This significant increase was primarily due to a significant improvement in the
operating results of the Devices, G&NS and HE&S segments. This improvement was partially offset by a
significant deterioration in operating results in the MC segment, primarily due to a 176.0 billion yen impairment
of goodwill.
44