Sony 2015 Annual Report Download - page 42
Download and view the complete annual report
Please find page 42 of the 2015 Sony annual report below. You can navigate through the pages in the report by either clicking on the pages listed below, or by using the keyword search tool below to find specific information within the annual report.-
 1
1 -
2
-
3
-
4
-
5
-
6
-
7
-
8
-
9
-
10
-
11
-
12
-
13
-
14
-
15
-
16
-
17
-
18
-
19
-
20
-
21
-
22
-
23
-
24
-
25
-
26
-
27
-
28
-
29
-
30
-
31
-
 32
32 -
 33
33 -
 34
34 -
 35
35 -
 36
36 -
 37
37 -
 38
38 -
 39
39 -
 40
40 -
 41
41 -
 42
42 -
 43
43 -
 44
44 -
 45
45 -
 46
46 -
 47
47 -
 48
48 -
 49
49 -
 50
50 -
 51
51 -
 52
52 -
53
-
54
-
55
-
56
-
57
-
58
-
59
-
60
-
61
-
62
-
63
-
64
-
65
-
66
-
67
-
68
-
69
-
70
-
71
-
72
-
73
-
74
-
75
-
76
-
77
-
78
-
79
-
80
-
81
-
82
-
83
-
84
-
85
-
86
-
87
-
88
-
89
-
90
-
91
-
92
-
93
-
94
-
95
-
96
-
97
-
98
-
99
-
100
-
101
-
102
-
103
-
104
-
105
-
106
-
107
-
108
-
109
-
110
-
111
-
112
-
113
-
114
-
115
-
116
-
117
-
118
-
119
-
120
-
121
-
122
-
123
-
124
-
125
-
126
-
127
-
128
-
129
-
130
-
131
-
132
-
133
-
134
-
135
-
136
-
137
-
138
-
139
-
140
-
141
-
142
-
143
-
144
-
145
-
146
-
147
-
148
-
149
-
150
-
151
-
152
-
153
-
154
-
155
-
156
-
157
-
158
-
159
-
160
-
161
-
162
-
163
-
164
-
165
-
166
-
167
-
168
-
169
-
170
-
171
-
172
-
173
-
174
-
175
-
176
-
177
-
178
-
179
-
180
-
181
-
182
-
183
-
184
-
185
-
186
-
187
-
188
-
189
-
190
-
191
-
192
-
193
-
194
-
195
-
196
-
197
-
198
-
199
-
200
-
201
-
202
-
203
-
204
-
205
-
206
-
207
-
208
-
209
-
210
-
211
-
212
-
213
-
214
-
215
-
216
-
217
-
218
-
219
-
220
-
221
-
222
-
223
-
224
-
225
-
226
-
227
-
228
-
229
-
230
-
231
-
232
 |
 |

** Sony EMCS Corporation changed its name to Sony Global Manufacturing & Operations Corporation in April
2016.
*** SCEI changed its name to Sony Interactive Entertainment Inc. in April 2016. SCEA changed its name to
Sony Interactive Entertainment America LLC in April 2016. SCEE changed its name to Sony Interactive
Entertainment Europe Limited in April 2016.
Item 4A. Unresolved Staff Comments
Not applicable
Item 5. Operating and Financial Review and Prospects
A. Operating Results
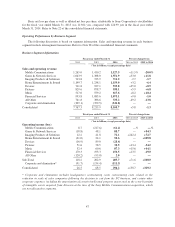
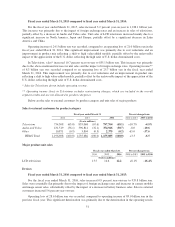
Operating Performance
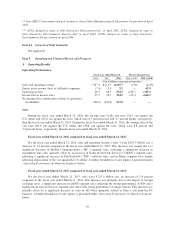
Fiscal year ended March 31 Percent change from
2014 2015 2016 2014 to 2015 2015 to 2016
(Yen in billions, except percentage data)
Sales and operating revenue 7,767.3 8,215.9 8,105.7 +5.8% -1.3%
Equity in net income (loss) of affiliated companies (7.4) 3.9 2.2 —-42.9
Operating income 26.5 68.5 294.2 +158.7 +329.2
Income before income taxes 25.7 39.7 304.5 +54.3 +666.5
Net income (loss) attributable to Sony Corporation’s
stockholders (128.4) (126.0) 147.8 ——
Sales
During the fiscal year ended March 31, 2016, the average rates of the yen were 120.1 yen against the
U.S. dollar and 132.6 yen against the euro, which were 8.5 percent lower and 4.7 percent higher, respectively,
than the fiscal year ended March 31, 2015. During the fiscal year ended March 31, 2015, the average rates of the
yen were 109.9 yen against the U.S. dollar and 138.8 yen against the euro, which were 8.8 percent and
3.2 percent lower, respectively, than the fiscal year ended March 31, 2014.
Fiscal year ended March 31, 2016 compared to fiscal year ended March 31, 2015:
For the fiscal year ended March 31, 2016, sales and operating revenue (“sales”) were 8,105.7 billion yen, a
decrease of 1.3 percent compared to the fiscal year ended March 31, 2015. This decrease was mainly due to a
significant decrease in Mobile Communications (“MC”) segment sales, reflecting a significant decrease in
smartphone unit sales, partially offset by an increase in Game & Network Services (“G&NS”) segment sales,
reflecting a significant increase in PlayStation®4 (“PS4”) software sales, and in Music segment sales mainly
reflecting depreciation of the yen against the U.S. dollar. A further breakdown of sales figures is presented under
“Operating Performance by Business Segment” below.
Fiscal year ended March 31, 2015 compared to fiscal year ended March 31, 2014:
For the fiscal year ended March 31, 2015, sales were 8,215.9 billion yen, an increase of 5.8 percent
compared to the fiscal year ended March 31, 2014. This increase was primarily due to the impact of foreign
exchange rates, a significant increase in G&NS segment sales reflecting the strong performance of PS4 and a
significant increase in Devices segment sales due to the strong performance of image sensors. This increase was
partially offset by a significant decrease in sales in All Other, primarily related to Sony’s exit from the PC
business. A further breakdown of sales figures is presented under “Operating Performance by Business Segment”
below.
42