Sony 2015 Annual Report Download - page 178
Download and view the complete annual report
Please find page 178 of the 2015 Sony annual report below. You can navigate through the pages in the report by either clicking on the pages listed below, or by using the keyword search tool below to find specific information within the annual report.-
 1
1 -
2
-
3
-
4
-
5
-
6
-
7
-
8
-
9
-
10
-
11
-
12
-
13
-
14
-
15
-
16
-
17
-
18
-
19
-
20
-
21
-
22
-
23
-
24
-
25
-
26
-
27
-
28
-
29
-
30
-
31
-
32
-
33
-
34
-
35
-
36
-
37
-
38
-
39
-
40
-
41
-
42
-
43
-
44
-
45
-
46
-
47
-
48
-
49
-
50
-
51
-
52
-
53
-
54
-
55
-
56
-
57
-
58
-
59
-
60
-
61
-
62
-
63
-
64
-
65
-
66
-
67
-
68
-
69
-
70
-
71
-
72
-
73
-
74
-
75
-
76
-
77
-
78
-
79
-
80
-
81
-
82
-
83
-
84
-
85
-
86
-
87
-
88
-
89
-
90
-
91
-
92
-
93
-
94
-
95
-
96
-
97
-
98
-
99
-
100
-
101
-
102
-
103
-
104
-
105
-
106
-
107
-
108
-
109
-
110
-
111
-
112
-
113
-
114
-
115
-
116
-
117
-
118
-
119
-
120
-
121
-
122
-
123
-
124
-
125
-
126
-
127
-
128
-
129
-
130
-
131
-
132
-
133
-
134
-
135
-
136
-
137
-
138
-
139
-
140
-
141
-
142
-
143
-
144
-
145
-
146
-
147
-
148
-
149
-
150
-
151
-
152
-
153
-
154
-
155
-
156
-
157
-
158
-
159
-
160
-
161
-
162
-
163
-
164
-
165
-
166
-
167
-
 168
168 -
 169
169 -
 170
170 -
 171
171 -
 172
172 -
 173
173 -
 174
174 -
 175
175 -
 176
176 -
 177
177 -
 178
178 -
 179
179 -
 180
180 -
 181
181 -
 182
182 -
 183
183 -
 184
184 -
 185
185 -
 186
186 -
 187
187 -
 188
188 -
189
-
190
-
191
-
192
-
193
-
194
-
195
-
196
-
197
-
198
-
199
-
200
-
201
-
202
-
203
-
204
-
205
-
206
-
207
-
208
-
209
-
210
-
211
-
212
-
213
-
214
-
215
-
216
-
217
-
218
-
219
-
220
-
221
-
222
-
223
-
224
-
225
-
226
-
227
-
228
-
229
-
230
-
231
-
232
 |
 |

SONY CORPORATION AND CONSOLIDATED SUBSIDIARIES
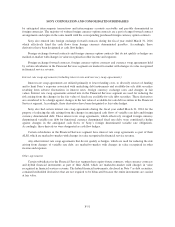
applied. Where derivative products have been established for some time, Sony uses models that are widely
accepted in the financial services industry. These models reflect the contractual terms of the derivatives,
including the period to maturity, and market-based parameters such as interest rates, volatility, and the credit
rating of the counterparty. Further, many of these models do not contain a high level of subjectivity as the
techniques used in the models do not require significant judgment, and inputs to the model are readily observable
from actively quoted markets. Such instruments are generally classified within level 2 of the fair value hierarchy.
In determining the fair value of Sony’s interest rate swap derivatives, Sony uses the present value of
expected cash flows based on market observable interest rate yield curves commensurate with the term of each
instrument. For foreign currency derivatives, Sony’s approach is to use forward contract and option valuation
models employing market observable inputs, such as spot currency rates, time value and option volatilities. These
derivatives are classified within level 2 since Sony primarily uses observable inputs in its valuation of its
derivative assets and liabilities.
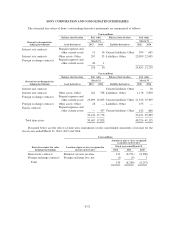
The fair value of Sony’s assets and liabilities that are measured at fair value on a recurring basis at
March 31, 2015 and 2016 are as follows:
Yen in millions
March 31, 2015
Presentation in the consolidated balance sheets
Level 1 Level 2 Level 3 Total
Marketable
securities
Securities
investments
and other
Other
current
assets/
liabilities
Other
noncurrent
assets/
liabilities
Assets:
Trading securities 452,830 311,643 — 764,473 764,473 — — —
Available-for-sale securities
Debt securities
Japanese national
government bonds — 1,222,094 — 1,222,094 3,124 1,218,970 — —
Japanese local government
bonds — 66,891 — 66,891 1,474 65,417 — —
Japanese corporate bonds — 105,363 3,506 108,869 27,030 81,839 — —
Foreign government bonds 2,861 38,593 — 41,454 136 41,318 — —
Foreign corporate bonds — 455,357 9,491 464,848 139,540 325,308 — —
Equity securities 199,874 118 — 199,992 — 199,992 — —
Other investments*1 9,306 4,606 74,641 88,553 — 88,553 — —
Derivative assets*2 — 30,407 — 30,407 — — 29,951 456
Total assets 664,871 2,235,072 87,638 2,987,581 935,777 2,021,397 29,951 456
Liabilities:
Derivative liabilities*2 612 47,712 — 48,324 — — 23,092 25,232
Total liabilities 612 47,712 — 48,324 — — 23,092 25,232
F-44