Sony 2015 Annual Report Download - page 103
Download and view the complete annual report
Please find page 103 of the 2015 Sony annual report below. You can navigate through the pages in the report by either clicking on the pages listed below, or by using the keyword search tool below to find specific information within the annual report.-
 1
1 -
2
-
3
-
4
-
5
-
6
-
7
-
8
-
9
-
10
-
11
-
12
-
13
-
14
-
15
-
16
-
17
-
18
-
19
-
20
-
21
-
22
-
23
-
24
-
25
-
26
-
27
-
28
-
29
-
30
-
31
-
32
-
33
-
34
-
35
-
36
-
37
-
38
-
39
-
40
-
41
-
42
-
43
-
44
-
45
-
46
-
47
-
48
-
49
-
50
-
51
-
52
-
53
-
54
-
55
-
56
-
57
-
58
-
59
-
60
-
61
-
62
-
63
-
64
-
65
-
66
-
67
-
68
-
69
-
70
-
71
-
72
-
73
-
74
-
75
-
76
-
77
-
78
-
79
-
80
-
81
-
82
-
83
-
84
-
85
-
86
-
87
-
88
-
89
-
90
-
91
-
92
-
 93
93 -
 94
94 -
 95
95 -
 96
96 -
 97
97 -
 98
98 -
 99
99 -
 100
100 -
 101
101 -
 102
102 -
 103
103 -
 104
104 -
 105
105 -
 106
106 -
 107
107 -
 108
108 -
 109
109 -
 110
110 -
 111
111 -
 112
112 -
 113
113 -
114
-
115
-
116
-
117
-
118
-
119
-
120
-
121
-
122
-
123
-
124
-
125
-
126
-
127
-
128
-
129
-
130
-
131
-
132
-
133
-
134
-
135
-
136
-
137
-
138
-
139
-
140
-
141
-
142
-
143
-
144
-
145
-
146
-
147
-
148
-
149
-
150
-
151
-
152
-
153
-
154
-
155
-
156
-
157
-
158
-
159
-
160
-
161
-
162
-
163
-
164
-
165
-
166
-
167
-
168
-
169
-
170
-
171
-
172
-
173
-
174
-
175
-
176
-
177
-
178
-
179
-
180
-
181
-
182
-
183
-
184
-
185
-
186
-
187
-
188
-
189
-
190
-
191
-
192
-
193
-
194
-
195
-
196
-
197
-
198
-
199
-
200
-
201
-
202
-
203
-
204
-
205
-
206
-
207
-
208
-
209
-
210
-
211
-
212
-
213
-
214
-
215
-
216
-
217
-
218
-
219
-
220
-
221
-
222
-
223
-
224
-
225
-
226
-
227
-
228
-
229
-
230
-
231
-
232
 |
 |

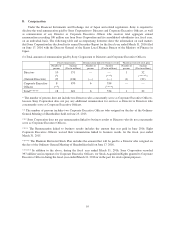
Year granted
(Fiscal year ended March 31)
Total number of
shares subject to stock
acquisition rights Exercise price per share
(in thousands)
2013 ............................................... 200 11.23 U.S. dollars
2013 ............................................... 44 932yen
2012 ............................................... 80 19.44 U.S. dollars
2012 ............................................... 27 1,523 yen
2011 ............................................... 50 35.48 U.S. dollars
2011 ............................................... 31 2,945 yen
2010 ............................................... 50 29.56 U.S. dollars
2010 ............................................... 23 2,595 yen
2009 ............................................... 30 30.24 U.S. dollars
2009 ............................................... 17 2,987 yen
2008 ............................................... 30 48.15 U.S. dollars
2008 ............................................... 15 5,514 yen
2007 ............................................... 24 40.05 U.S. dollars
2007 ............................................... 11 4,756 yen
Regarding the above compensation plans, refer to Note 17 of the consolidated financial statements.
Item 7. Major Shareholders and Related Party Transactions
A. Major Shareholders
As of March 31, 2016, there were 1,262,493,760 shares of common stock outstanding, including
1,047,745 shares of treasury stock. Out of the total outstanding shares, 111,327,333 shares were in the form of
ADRs and 276,930,030 shares were held of record in the form of common stock by residents in the U.S. As of
March 31, 2016, the number of registered ADR holders was 5,974 and the number of registered holders of
common stock of Sony Corporation in the U.S. was 373.
The Financial Instruments and Exchange Act of Japan requires any person who solely or jointly owns more
than five percent of total issued voting shares of a company listed on any Japanese stock exchange to file with the
Director General of the Kanto Local Finance Bureau (“Bureau”) a Bulk Shareholding Report. The following
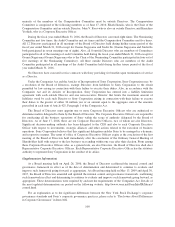
table summarizes the Bulk Shareholding Reports related to Sony (each a “Report”) submitted to the Bureau,
where it is reported that ownership percentage by the reported entity exceeds five percent in the most recent
updated Report. The Reports do not specify whether reported ownership is direct or beneficial.
Date of Report* Reported entities
Reported number of direct or
indirect owned and
deemed owned shares**
Reported percentage of direct or
indirect owned and
deemed owned shares**
April 4, 2014 Sumitomo Mitsui Trust Bank, Limited 52,312,421 5.04
July 22, 2014 BlackRock Japan Co., Ltd. 52,313,772 5.01
May 20, 2016 Capital Research and Management
Company
86,520,000 6.85
* The table above contains information from the most recent updated Reports.
** Shares issuable or transferable upon exchange of exchangeable securities, conversion of convertible
securities or exercise of warrants or stock acquisition rights (including those incorporated in bonds with stock
acquisition rights) are taken into account in determining both the size of the reported entity’s holding and Sony’s
total issued share capital.
To the knowledge of Sony Corporation, it is not directly or indirectly owned or controlled by any other
corporation, by any foreign government or by any other natural or legal person either severally or jointly. As far
as is known to Sony Corporation, there are no arrangements the operation of which may, at a subsequent date,
result in a change in control of Sony Corporation.
103