Sony 2015 Annual Report Download - page 190
Download and view the complete annual report
Please find page 190 of the 2015 Sony annual report below. You can navigate through the pages in the report by either clicking on the pages listed below, or by using the keyword search tool below to find specific information within the annual report.-
 1
1 -
2
-
3
-
4
-
5
-
6
-
7
-
8
-
9
-
10
-
11
-
12
-
13
-
14
-
15
-
16
-
17
-
18
-
19
-
20
-
21
-
22
-
23
-
24
-
25
-
26
-
27
-
28
-
29
-
30
-
31
-
32
-
33
-
34
-
35
-
36
-
37
-
38
-
39
-
40
-
41
-
42
-
43
-
44
-
45
-
46
-
47
-
48
-
49
-
50
-
51
-
52
-
53
-
54
-
55
-
56
-
57
-
58
-
59
-
60
-
61
-
62
-
63
-
64
-
65
-
66
-
67
-
68
-
69
-
70
-
71
-
72
-
73
-
74
-
75
-
76
-
77
-
78
-
79
-
80
-
81
-
82
-
83
-
84
-
85
-
86
-
87
-
88
-
89
-
90
-
91
-
92
-
93
-
94
-
95
-
96
-
97
-
98
-
99
-
100
-
101
-
102
-
103
-
104
-
105
-
106
-
107
-
108
-
109
-
110
-
111
-
112
-
113
-
114
-
115
-
116
-
117
-
118
-
119
-
120
-
121
-
122
-
123
-
124
-
125
-
126
-
127
-
128
-
129
-
130
-
131
-
132
-
133
-
134
-
135
-
136
-
137
-
138
-
139
-
140
-
141
-
142
-
143
-
144
-
145
-
146
-
147
-
148
-
149
-
150
-
151
-
152
-
153
-
154
-
155
-
156
-
157
-
158
-
159
-
160
-
161
-
162
-
163
-
164
-
165
-
166
-
167
-
168
-
169
-
170
-
171
-
172
-
173
-
174
-
175
-
176
-
177
-
178
-
179
-
 180
180 -
 181
181 -
 182
182 -
 183
183 -
 184
184 -
 185
185 -
 186
186 -
 187
187 -
 188
188 -
 189
189 -
 190
190 -
 191
191 -
 192
192 -
 193
193 -
 194
194 -
 195
195 -
 196
196 -
 197
197 -
 198
198 -
 199
199 -
 200
200 -
201
-
202
-
203
-
204
-
205
-
206
-
207
-
208
-
209
-
210
-
211
-
212
-
213
-
214
-
215
-
216
-
217
-
218
-
219
-
220
-
221
-
222
-
223
-
224
-
225
-
226
-
227
-
228
-
229
-
230
-
231
-
232
 |
 |

SONY CORPORATION AND CONSOLIDATED SUBSIDIARIES
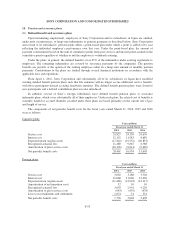
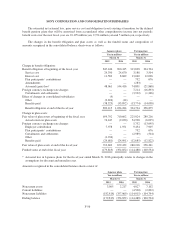
The estimated net actuarial loss, prior service cost and obligation (asset) existing at transition for the defined
benefit pension plans that will be amortized from accumulated other comprehensive income into net periodic
benefit costs over the next fiscal year are 23,195 million yen, 9,974 million yen and 5 million yen, respectively.
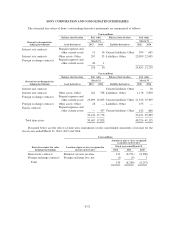
The changes in the benefit obligation and plan assets as well as the funded status and composition of
amounts recognized in the consolidated balance sheets were as follows:
Japanese plans Foreign plans
Yen in millions Yen in millions
March 31 March 31
2015 2016 2015 2016
Change in benefit obligation:
Benefit obligation at beginning of the fiscal year 847,446 890,415 313,698 394,704
Service cost 24,350 24,670 3,188 3,504
Interest cost 11,583 8,689 13,040 12,096
Plan participants’ contributions — — 752 676
Amendments — — (283) —
Actuarial (gain) loss*48,061 144,416 74,801 (21,868)
Foreign currency exchange rate changes — — 7,214 (16,893)
Curtailments and settlements — — (3,932) (1,246)
Effect of changes in consolidated subsidiaries (4) — — —
Other (2,696) (14) — —
Benefits paid (38,325) (33,892) (13,774) (14,098)
Benefit obligation at end of the fiscal year 890,415 1,034,284 394,704 356,875
Change in plan assets:
Fair value of plan assets at beginning of the fiscal year 654,792 710,602 225,024 280,216
Actual return on plan assets 74,447 (9,030) 54,928 (6,035)
Foreign currency exchange rate changes — — 5,752 (13,095)
Employer contribution 7,978 1,951 9,434 7,905
Plan participants’ contributions — — 752 676
Curtailments and settlements — — (2,989) (504)
Other (1,934) — — —
Benefits paid (24,681) (24,091) (12,685) (12,822)
Fair value of plan assets at end of the fiscal year 710,602 679,432 280,216 256,341
Funded status at end of the fiscal year (179,813) (354,852) (114,488) (100,534)
* Actuarial loss in Japanese plans for the fiscal year ended March 31, 2016 principally relates to changes in the
assumptions for discount and mortality rates.
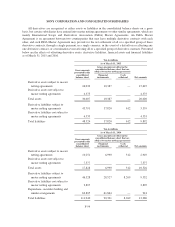
Amounts recognized in the consolidated balance sheets consist of:
Japanese plans Foreign plans
Yen in millions Yen in millions
March 31 March 31
2015 2016 2015 2016
Noncurrent assets 3,005 2,217 4,027 7,102
Current liabilities — — (4,500) (2,892)
Noncurrent liabilities (182,818) (357,069) (114,015) (104,744)
Ending balance (179,813) (354,852) (114,488) (100,534)
F-56