Sony 2015 Annual Report Download - page 106
Download and view the complete annual report
Please find page 106 of the 2015 Sony annual report below. You can navigate through the pages in the report by either clicking on the pages listed below, or by using the keyword search tool below to find specific information within the annual report.-
 1
1 -
2
-
3
-
4
-
5
-
6
-
7
-
8
-
9
-
10
-
11
-
12
-
13
-
14
-
15
-
16
-
17
-
18
-
19
-
20
-
21
-
22
-
23
-
24
-
25
-
26
-
27
-
28
-
29
-
30
-
31
-
32
-
33
-
34
-
35
-
36
-
37
-
38
-
39
-
40
-
41
-
42
-
43
-
44
-
45
-
46
-
47
-
48
-
49
-
50
-
51
-
52
-
53
-
54
-
55
-
56
-
57
-
58
-
59
-
60
-
61
-
62
-
63
-
64
-
65
-
66
-
67
-
68
-
69
-
70
-
71
-
72
-
73
-
74
-
75
-
76
-
77
-
78
-
79
-
80
-
81
-
82
-
83
-
84
-
85
-
86
-
87
-
88
-
89
-
90
-
91
-
92
-
93
-
94
-
95
-
 96
96 -
 97
97 -
 98
98 -
 99
99 -
 100
100 -
 101
101 -
 102
102 -
 103
103 -
 104
104 -
 105
105 -
 106
106 -
 107
107 -
 108
108 -
 109
109 -
 110
110 -
 111
111 -
 112
112 -
 113
113 -
 114
114 -
 115
115 -
 116
116 -
117
-
118
-
119
-
120
-
121
-
122
-
123
-
124
-
125
-
126
-
127
-
128
-
129
-
130
-
131
-
132
-
133
-
134
-
135
-
136
-
137
-
138
-
139
-
140
-
141
-
142
-
143
-
144
-
145
-
146
-
147
-
148
-
149
-
150
-
151
-
152
-
153
-
154
-
155
-
156
-
157
-
158
-
159
-
160
-
161
-
162
-
163
-
164
-
165
-
166
-
167
-
168
-
169
-
170
-
171
-
172
-
173
-
174
-
175
-
176
-
177
-
178
-
179
-
180
-
181
-
182
-
183
-
184
-
185
-
186
-
187
-
188
-
189
-
190
-
191
-
192
-
193
-
194
-
195
-
196
-
197
-
198
-
199
-
200
-
201
-
202
-
203
-
204
-
205
-
206
-
207
-
208
-
209
-
210
-
211
-
212
-
213
-
214
-
215
-
216
-
217
-
218
-
219
-
220
-
221
-
222
-
223
-
224
-
225
-
226
-
227
-
228
-
229
-
230
-
231
-
232
 |
 |

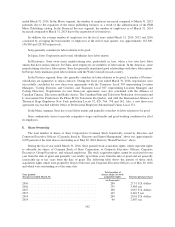
Trading on the TSE and the NYSE
The following table sets forth for the periods indicated the reported high and low sales prices per share of
Sony Corporation’s Common Stock on the TSE and the reported high and low sales prices per share of Sony
Corporation’s ADS on the NYSE.
Tokyo Stock Exchange
price per
share of Common Stock
New York Stock
Exchange price
per share of ADS
High Low High Low
(yen) (U.S. dollars)
Annual highs and lows*
The fiscal year ended March 31, 2012 .................. 2,727 1,253 32.09 16.16
The fiscal year ended March 31, 2013 .................. 1,750 772 20.83 9.57
The fiscal year ended March 31, 2014 .................. 2,413 1,497 23.38 15.23
Quarterly highs and lows*
The fiscal year ended March 31, 2015 .................. 3,450 1,588 28.65 15.93
1st quarter ...................................... 2,030 1,588 19.46 15.93
2nd quarter ...................................... 2,173 1,655 20.35 16.43
3rd quarter ...................................... 2,696.5 1,782 22.32 16.57
4th quarter ...................................... 3,450 2,351.5 28.65 20.15
Quarterly highs and lows*
The fiscal year ended March 31, 2016 .................. 3,970 2,199 32.95 19.90
1st quarter ...................................... 3,970 3,195 32.95 27.00
2nd quarter ...................................... 3,719 2,713 29.99 21.51
3rd quarter ...................................... 3,568 2,887 29.08 23.97
4th quarter ...................................... 3,066 2,199 26.49 19.90
Monthly highs and lows*
2015
December ...................................... 3,259 2,887 26.36 23.97
2016
January ........................................ 3,066 2,361 25.72 19.90
February ....................................... 2,924 2,199 23.33 20.11
March ......................................... 2,997 2,313.5 26.49 21.24
April .......................................... 3,074 2,707 28.17 23.95
May ........................................... 3,119 2,541 28.11 23.62
June (through June 10) ........................... 3,122 2,995 29.21 27.64
* Stock price data are based on prices throughout the sessions for each corresponding period at each stock
exchange.
On June 10, 2016, the closing sales price per share of Sony Corporation’s Common Stock on the TSE was
3,051 yen. On June 10, 2016, the closing sales price per share of Sony Corporation’s ADS on the NYSE
was 28.03 U.S. dollars.
B. Plan of Distribution
Not Applicable
C. Markets
Please refer to Item 9 A “Offer and Listing Details.”
D. Selling Shareholders
Not Applicable
106