Sony 2015 Annual Report Download - page 182
Download and view the complete annual report
Please find page 182 of the 2015 Sony annual report below. You can navigate through the pages in the report by either clicking on the pages listed below, or by using the keyword search tool below to find specific information within the annual report.-
 1
1 -
2
-
3
-
4
-
5
-
6
-
7
-
8
-
9
-
10
-
11
-
12
-
13
-
14
-
15
-
16
-
17
-
18
-
19
-
20
-
21
-
22
-
23
-
24
-
25
-
26
-
27
-
28
-
29
-
30
-
31
-
32
-
33
-
34
-
35
-
36
-
37
-
38
-
39
-
40
-
41
-
42
-
43
-
44
-
45
-
46
-
47
-
48
-
49
-
50
-
51
-
52
-
53
-
54
-
55
-
56
-
57
-
58
-
59
-
60
-
61
-
62
-
63
-
64
-
65
-
66
-
67
-
68
-
69
-
70
-
71
-
72
-
73
-
74
-
75
-
76
-
77
-
78
-
79
-
80
-
81
-
82
-
83
-
84
-
85
-
86
-
87
-
88
-
89
-
90
-
91
-
92
-
93
-
94
-
95
-
96
-
97
-
98
-
99
-
100
-
101
-
102
-
103
-
104
-
105
-
106
-
107
-
108
-
109
-
110
-
111
-
112
-
113
-
114
-
115
-
116
-
117
-
118
-
119
-
120
-
121
-
122
-
123
-
124
-
125
-
126
-
127
-
128
-
129
-
130
-
131
-
132
-
133
-
134
-
135
-
136
-
137
-
138
-
139
-
140
-
141
-
142
-
143
-
144
-
145
-
146
-
147
-
148
-
149
-
150
-
151
-
152
-
153
-
154
-
155
-
156
-
157
-
158
-
159
-
160
-
161
-
162
-
163
-
164
-
165
-
166
-
167
-
168
-
169
-
170
-
171
-
 172
172 -
 173
173 -
 174
174 -
 175
175 -
 176
176 -
 177
177 -
 178
178 -
 179
179 -
 180
180 -
 181
181 -
 182
182 -
 183
183 -
 184
184 -
 185
185 -
 186
186 -
 187
187 -
 188
188 -
 189
189 -
 190
190 -
 191
191 -
 192
192 -
193
-
194
-
195
-
196
-
197
-
198
-
199
-
200
-
201
-
202
-
203
-
204
-
205
-
206
-
207
-
208
-
209
-
210
-
211
-
212
-
213
-
214
-
215
-
216
-
217
-
218
-
219
-
220
-
221
-
222
-
223
-
224
-
225
-
226
-
227
-
228
-
229
-
230
-
231
-
232
 |
 |
SONY CORPORATION AND CONSOLIDATED SUBSIDIARIES
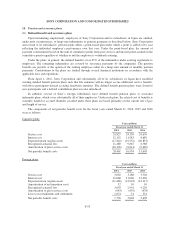
carrying amount of the long-lived assets within the period applicable to the impairment determination, resulting
in an impairment charge. In the fiscal year ended March 31, 2016, due to increasingly competitive markets, Sony
conducted a further strategic review of the business and evolving market trends. Following this review, Sony
further reduced the corresponding estimated future cash flows of this business and the estimated ability to
recover the entire carrying amount of the long-lived assets within the period applicable to the impairment
determination, resulting in an impairment charge.
Sony recorded impairment losses of 12,303 million yen for the fiscal year ended March 31, 2014, included
within All Other, related to long-lived assets in the disc manufacturing business. In the fiscal year ended
March 31, 2015, Sony recorded an impairment loss of 8,608 million yen related to long-lived assets in the disc
manufacturing business. The long-lived asset impairments in the disc manufacturing business for fiscal years
ended March 31, 2014 and 2015 related to lowered forecasts of cash flows outside of Japan and the
United States, primarily attributable to the manufacturing and distribution operations in Europe, which began
additional restructuring activities in March 2014 and March 2015, and reflects the faster than expected
contraction of the physical media market.
Sony recorded impairment losses of 59,616 million yen for the fiscal year ended March 31, 2016, included
within the Devices segment, related to long-lived assets in the camera module business asset group. Due to a
decrease in the projected future demand of camera modules, Sony conducted a strategic review of the business
and its market conditions. Following this review, Sony reduced the corresponding estimated future cash flows
and the estimated ability to recover the entire carrying amount of the long-lived assets within the period
applicable to the impairment determination, resulting in an impairment charge.
Sony recorded impairment losses for long-lived assets relating to restructuring in the PC business during the
fiscal year ended March 31, 2014. Refer to Notes 19 and 25.
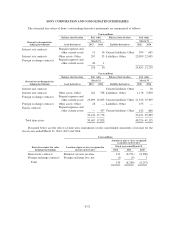
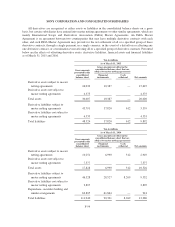
These measurements are classified as level 3 because significant unobservable inputs, such as the conditions
of the assets or projections of future cash flows, the timing of such cash flows and the discount rate reflecting the
risk inherent in future cash flows, were considered in the fair value measurements. A discount rate of 10% and
projected revenue growth rates ranging from zero to 15% were used in the fair value measurements related to the
long-lived assets for the battery business, and a discount rate of 10% and projected declining revenue rates
ranging from (6)% to (13)% were used in the fair value measurements related to the long-lived assets for the disc
manufacturing business for the fiscal year ended March 31, 2014. For the fiscal year ended March 31, 2015, a
discount rate of 10% and projected declining revenue rates ranging from (5)% to (9)% were used in the fair value
measurements related to the long-lived assets for the disc manufacturing business. For the fiscal year ended
March 31, 2016, a discount rate of 10% and projected revenue growth rates ranging from zero to 14% were used
in the fair value measurements related to the long-lived assets for the battery business and a discount rate of 10%
and projected revenue growth rates ranging from zero to 108% were used in the fair value measurements related
to the long-lived assets for the camera module business. The high end of the camera module revenue growth rate
reflects projected revenue from the introduction of new products in the near term.
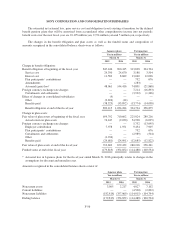
Goodwill impairments
Sony recorded an impairment loss of 176,045 million yen for the fiscal year ended March 31, 2015 related
to goodwill in the MC segment. Refer to Note 9. Sony’s determination of fair value of the MC reporting unit was
based on the present value of expected future cash flows. These measurements are classified as a level 3 because
significant unobservable inputs, such as the projections of future cash flows, the timing of such cash flows and
the discount rate reflecting the risk inherent in future cash flows, were considered in the fair value
measurements. A discount rate of 12% and projected revenue growth rates ranging from (3)% to 11% were used
in the fair value measurements.
F-48