Sony 2015 Annual Report Download - page 144
Download and view the complete annual report
Please find page 144 of the 2015 Sony annual report below. You can navigate through the pages in the report by either clicking on the pages listed below, or by using the keyword search tool below to find specific information within the annual report.-
 1
1 -
2
-
3
-
4
-
5
-
6
-
7
-
8
-
9
-
10
-
11
-
12
-
13
-
14
-
15
-
16
-
17
-
18
-
19
-
20
-
21
-
22
-
23
-
24
-
25
-
26
-
27
-
28
-
29
-
30
-
31
-
32
-
33
-
34
-
35
-
36
-
37
-
38
-
39
-
40
-
41
-
42
-
43
-
44
-
45
-
46
-
47
-
48
-
49
-
50
-
51
-
52
-
53
-
54
-
55
-
56
-
57
-
58
-
59
-
60
-
61
-
62
-
63
-
64
-
65
-
66
-
67
-
68
-
69
-
70
-
71
-
72
-
73
-
74
-
75
-
76
-
77
-
78
-
79
-
80
-
81
-
82
-
83
-
84
-
85
-
86
-
87
-
88
-
89
-
90
-
91
-
92
-
93
-
94
-
95
-
96
-
97
-
98
-
99
-
100
-
101
-
102
-
103
-
104
-
105
-
106
-
107
-
108
-
109
-
110
-
111
-
112
-
113
-
114
-
115
-
116
-
117
-
118
-
119
-
120
-
121
-
122
-
123
-
124
-
125
-
126
-
127
-
128
-
129
-
130
-
131
-
132
-
133
-
 134
134 -
 135
135 -
 136
136 -
 137
137 -
 138
138 -
 139
139 -
 140
140 -
 141
141 -
 142
142 -
 143
143 -
 144
144 -
 145
145 -
 146
146 -
 147
147 -
 148
148 -
 149
149 -
 150
150 -
 151
151 -
 152
152 -
 153
153 -
 154
154 -
155
-
156
-
157
-
158
-
159
-
160
-
161
-
162
-
163
-
164
-
165
-
166
-
167
-
168
-
169
-
170
-
171
-
172
-
173
-
174
-
175
-
176
-
177
-
178
-
179
-
180
-
181
-
182
-
183
-
184
-
185
-
186
-
187
-
188
-
189
-
190
-
191
-
192
-
193
-
194
-
195
-
196
-
197
-
198
-
199
-
200
-
201
-
202
-
203
-
204
-
205
-
206
-
207
-
208
-
209
-
210
-
211
-
212
-
213
-
214
-
215
-
216
-
217
-
218
-
219
-
220
-
221
-
222
-
223
-
224
-
225
-
226
-
227
-
228
-
229
-
230
-
231
-
232
 |
 |

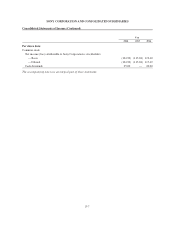
SONY CORPORATION AND CONSOLIDATED SUBSIDIARIES
Consolidated Statements of Cash Flows (Continued)
Yen in millions
2014 2015 2016
Cash flows from investing activities:
Payments for purchases of fixed assets (283,457) (215,916) (375,411)
Proceeds from sales of fixed assets 99,694 36,777 26,472
Payments for investments and advances by financial services business (1,032,594) (960,045) (1,221,093)
Payments for investments and advances (other than financial services
business) (14,892) (20,029) (20,830)
Proceeds from sales or return of investments and collections of
advances by financial services business 426,621 482,537 534,072
Proceeds from sales or return of investments and collections of
advances (other than financial services business) 75,417 49,479 81,535
Proceeds from sales of businesses 15,016 93 17,790
Other 3,693 (12,532) (72,938)
Net cash used in investing activities (710,502) (639,636) (1,030,403)
Cash flows from financing activities:
Proceeds from issuance of long-term debt 178,935 18,507 19,076
Payments of long-term debt (164,540) (258,102) (270,669)
Increase (decrease) in short-term borrowings, net 25,183 (51,013) 98,153
Increase in deposits from customers in the financial services business,
net 238,828 57,464 165,169
Proceeds from issuance of convertible bonds — — 120,000
Proceeds from issuance of new shares of common stock — — 301,708
Dividends paid (25,643) (13,160) (12,751)
Other (44,886) (16,891) (40,564)
Net cash provided by (used in) financing activities 207,877 (263,195) 380,122
Effect of exchange rate changes on cash and cash equivalents 58,614 51,138 (64,609)
Net increase (decrease) in cash and cash equivalents 220,105 (97,053) 34,199
Cash and cash equivalents at beginning of the fiscal year 826,361 1,046,466 949,413
Cash and cash equivalents at end of the fiscal year 1,046,466 949,413 983,612
Supplemental data:
Cash paid during the fiscal year for —
Income taxes 101,091 97,775 138,770
Interest 23,819 21,982 26,166
Non-cash investing and financing activities —
Conversion of convertible bonds 31,220 118,780 —
Obtaining assets by entering into capital leases 82,260 10,714 14,759
Collections of deferred proceeds from sales of receivables — 35,196 22,512 2,298
The accompanying notes are an integral part of these statements.
F-10