Sony 2015 Annual Report Download - page 79
Download and view the complete annual report
Please find page 79 of the 2015 Sony annual report below. You can navigate through the pages in the report by either clicking on the pages listed below, or by using the keyword search tool below to find specific information within the annual report.-
 1
1 -
2
-
3
-
4
-
5
-
6
-
7
-
8
-
9
-
10
-
11
-
12
-
13
-
14
-
15
-
16
-
17
-
18
-
19
-
20
-
21
-
22
-
23
-
24
-
25
-
26
-
27
-
28
-
29
-
30
-
31
-
32
-
33
-
34
-
35
-
36
-
37
-
38
-
39
-
40
-
41
-
42
-
43
-
44
-
45
-
46
-
47
-
48
-
49
-
50
-
51
-
52
-
53
-
54
-
55
-
56
-
57
-
58
-
59
-
60
-
61
-
62
-
63
-
64
-
65
-
66
-
67
-
68
-
 69
69 -
 70
70 -
 71
71 -
 72
72 -
 73
73 -
 74
74 -
 75
75 -
 76
76 -
 77
77 -
 78
78 -
 79
79 -
 80
80 -
 81
81 -
 82
82 -
 83
83 -
 84
84 -
 85
85 -
 86
86 -
 87
87 -
 88
88 -
 89
89 -
90
-
91
-
92
-
93
-
94
-
95
-
96
-
97
-
98
-
99
-
100
-
101
-
102
-
103
-
104
-
105
-
106
-
107
-
108
-
109
-
110
-
111
-
112
-
113
-
114
-
115
-
116
-
117
-
118
-
119
-
120
-
121
-
122
-
123
-
124
-
125
-
126
-
127
-
128
-
129
-
130
-
131
-
132
-
133
-
134
-
135
-
136
-
137
-
138
-
139
-
140
-
141
-
142
-
143
-
144
-
145
-
146
-
147
-
148
-
149
-
150
-
151
-
152
-
153
-
154
-
155
-
156
-
157
-
158
-
159
-
160
-
161
-
162
-
163
-
164
-
165
-
166
-
167
-
168
-
169
-
170
-
171
-
172
-
173
-
174
-
175
-
176
-
177
-
178
-
179
-
180
-
181
-
182
-
183
-
184
-
185
-
186
-
187
-
188
-
189
-
190
-
191
-
192
-
193
-
194
-
195
-
196
-
197
-
198
-
199
-
200
-
201
-
202
-
203
-
204
-
205
-
206
-
207
-
208
-
209
-
210
-
211
-
212
-
213
-
214
-
215
-
216
-
217
-
218
-
219
-
220
-
221
-
222
-
223
-
224
-
225
-
226
-
227
-
228
-
229
-
230
-
231
-
232
 |
 |

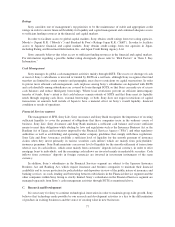
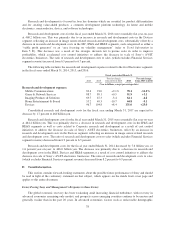
trends and low productivity growth continue to weigh on the recovery. In emerging markets, while growth in
China and most of emerging Asia is generally projected to be high, Brazil, Russia and other commodity exporters
face severe macroeconomic conditions. Furthermore, shocks of a noneconomic origin, related to geopolitical
conflicts, political discord, or terrorism loom over many regions, and could have a significant impact on the
global economy.
The uncertain economic environment surrounding Sony is compounded by continued, intense pricing
pressure from competitors, shrinking markets for certain key products and shorter product cycles, primarily in
Sony’s Electronics businesses.
On February 18, 2015, Sony unveiled its mid-range plan announcing that it would position Return on Equity
(“ROE”) as its most important performance indicator. With the goal of transforming into a highly profitable
enterprise, Sony set targets of ROE above 10 percent and operating income above 500 billion yen for the fiscal
year ending March 31, 2018, the last year of the mid-range plan.
Key strategies for business operations
• Business management that emphasizes profitability, without necessarily pursuing volume
• Business management that grants each business unit greater autonomy and mandates a focus on
shareholder value
• Clearly defined positioning of each business within a broader business portfolio perspective
Based on its specific characteristics and the competitive landscape, each of the Sony Group’s businesses is
classified as a “growth driver,” “stable profit generator,” or “area focusing on volatility management” in terms of
its position within Sony’s overall business portfolio. Each business has been assigned a target figure for Return
on Invested Capital (“ROIC”) linked with the ROE target for Sony Group as a whole, and managed with a clear
emphasis on profitability.
Due to the earthquake of April 14, 2016 and subsequent earthquakes in the Kumamoto region,
manufacturing operations were affected at Sony Semiconductor Manufacturing Corporation’s Kumamoto
Technology Center, which is the primary manufacturing site of image sensors mainly for digital cameras,
security cameras and micro-display devices. Sony is working to recover as soon as possible while prioritizing the
safety of its employees.
Group Environmental Mid-Term Targets “Green Management 2020”
Sony announced in June 2015 the establishment of its “Green Management 2020” group environmental
mid-term targets that will take effect from fiscal 2016 (the fiscal year ending March 31, 2017) through fiscal
2020 (the fiscal year ending March 31, 2021). Based on the following three pillars, Sony plans to implement
various initiatives to reduce the Sony Group’s environmental footprint:
• Formulate targets and implement initiatives that leverage the distinctive characteristics of Sony’s
businesses, from Electronics to entertainment. Among these, reduce annual energy consumption by an
average of 30 percent (compared to levels at the fiscal year ended March 31, 2014) in Electronics
products, and in entertainment, continue to look to use its contents to raise awareness of sustainability
issues and inspire environmentally conscious actions;
• Enhance efforts to reduce Sony’s environmental footprint across its entire value chain, including
manufacturing partners and suppliers, by calling on them to reduce greenhouse gas (GHG) emissions
and water consumption; and
• Accelerate the use of renewable energy.
Sony’s long-term vision is to achieve a “zero environmental footprint” throughout all stages of its product
lifecycles and business activities by 2050. The “Green Management 2020” mid-term plan has been backcasted
79