Sony 2015 Annual Report Download - page 7
Download and view the complete annual report
Please find page 7 of the 2015 Sony annual report below. You can navigate through the pages in the report by either clicking on the pages listed below, or by using the keyword search tool below to find specific information within the annual report.-
 1
1 -
 2
2 -
 3
3 -
 4
4 -
 5
5 -
 6
6 -
 7
7 -
 8
8 -
 9
9 -
 10
10 -
 11
11 -
 12
12 -
 13
13 -
 14
14 -
 15
15 -
 16
16 -
 17
17 -
 18
18 -
19
-
20
-
21
-
22
-
23
-
24
-
25
-
26
-
27
-
28
-
29
-
30
-
31
-
32
-
33
-
34
-
35
-
36
-
37
-
38
-
39
-
40
-
41
-
42
-
43
-
44
-
45
-
46
-
47
-
48
-
49
-
50
-
51
-
52
-
53
-
54
-
55
-
56
-
57
-
58
-
59
-
60
-
61
-
62
-
63
-
64
-
65
-
66
-
67
-
68
-
69
-
70
-
71
-
72
-
73
-
74
-
75
-
76
-
77
-
78
-
79
-
80
-
81
-
82
-
83
-
84
-
85
-
86
-
87
-
88
-
89
-
90
-
91
-
92
-
93
-
94
-
95
-
96
-
97
-
98
-
99
-
100
-
101
-
102
-
103
-
104
-
105
-
106
-
107
-
108
-
109
-
110
-
111
-
112
-
113
-
114
-
115
-
116
-
117
-
118
-
119
-
120
-
121
-
122
-
123
-
124
-
125
-
126
-
127
-
128
-
129
-
130
-
131
-
132
-
133
-
134
-
135
-
136
-
137
-
138
-
139
-
140
-
141
-
142
-
143
-
144
-
145
-
146
-
147
-
148
-
149
-
150
-
151
-
152
-
153
-
154
-
155
-
156
-
157
-
158
-
159
-
160
-
161
-
162
-
163
-
164
-
165
-
166
-
167
-
168
-
169
-
170
-
171
-
172
-
173
-
174
-
175
-
176
-
177
-
178
-
179
-
180
-
181
-
182
-
183
-
184
-
185
-
186
-
187
-
188
-
189
-
190
-
191
-
192
-
193
-
194
-
195
-
196
-
197
-
198
-
199
-
200
-
201
-
202
-
203
-
204
-
205
-
206
-
207
-
208
-
209
-
210
-
211
-
212
-
213
-
214
-
215
-
216
-
217
-
218
-
219
-
220
-
221
-
222
-
223
-
224
-
225
-
226
-
227
-
228
-
229
-
230
-
231
-
232
 |
 |

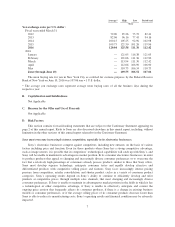
Average* High Low Period-end
(Yen)
Yen exchange rates per U.S. dollar:
Fiscal year ended March 31
2012 79.00 85.26 75.72 82.41
2013 82.96 96.16 77.41 94.16
2014 100.15 105.25 92.96 102.98
2015 109.75 121.50 101.26 119.96
2016 120.04 125.58 111.30 112.42
2016
January — 121.05 116.38 121.05
February — 121.06 111.36 112.90
March — 113.94 111.30 112.42
April — 112.06 106.90 106.90
May — 110.75 106.34 110.75
June (through June 10) — 109.55 106.54 107.06
The noon buying rate for yen in New York City as certified for customs purposes by the Federal Reserve
Bank of New York on June 10, 2016 was 107.06 yen = 1 U.S. dollar.
* The average yen exchange rates represent average noon buying rates of all the business days during the
respective year.
B. Capitalization and Indebtedness
Not Applicable
C. Reasons for the Offer and Use of Proceeds
Not Applicable
D. Risk Factors
This section contains forward-looking statements that are subject to the Cautionary Statement appearing on
page 2 of this annual report. Risks to Sony are also discussed elsewhere in this annual report, including, without
limitation in the other sections of this annual report referred to in the Cautionary Statement.
Sony must overcome increasingly intense competition, especially in its electronics businesses.
Sony’s electronics businesses compete against competitors, including new entrants, on the basis of various
factors including price and function. Even for those products where Sony has a strong competitive advantage,
such as image sensors, it is possible that its competitors’ technological capabilities will catch up with Sony’s, and
Sony will be unable to maintain its advantageous market position. In its consumer electronics businesses, in order
to produce products that appeal to changing and increasingly diverse consumer preferences or to overcome the
fact that a relatively high percentage of consumers already possess products similar to those that Sony offers,
Sony must develop superior technology, anticipate consumer tastes and rapidly develop attractive and
differentiated products with competitive selling prices and features. Sony faces increasingly intense pricing
pressure from competitors, retailer consolidation, and shorter product cycles in a variety of consumer product
categories. Sony’s operating results depend on Sony’s ability to continue to efficiently develop and offer
products at competitive prices, through multiple sales channels, that meet changing and increasingly diverse
consumer preferences. If Sony is unable to maintain its advantageous market position in the fields in which it has
a technological or other competitive advantage, if Sony is unable to effectively anticipate and counter the
ongoing price erosion that frequently affects its consumer products, if there is a change in existing business
models or consumer preferences, or if the average selling prices of its consumer products decrease faster than
Sony is able to reduce its manufacturing costs, Sony’s operating results and financial condition may be adversely
impacted.
7