Sony 2015 Annual Report Download - page 62
Download and view the complete annual report
Please find page 62 of the 2015 Sony annual report below. You can navigate through the pages in the report by either clicking on the pages listed below, or by using the keyword search tool below to find specific information within the annual report.-
 1
1 -
2
-
3
-
4
-
5
-
6
-
7
-
8
-
9
-
10
-
11
-
12
-
13
-
14
-
15
-
16
-
17
-
18
-
19
-
20
-
21
-
22
-
23
-
24
-
25
-
26
-
27
-
28
-
29
-
30
-
31
-
32
-
33
-
34
-
35
-
36
-
37
-
38
-
39
-
40
-
41
-
42
-
43
-
44
-
45
-
46
-
47
-
48
-
49
-
50
-
51
-
 52
52 -
 53
53 -
 54
54 -
 55
55 -
 56
56 -
 57
57 -
 58
58 -
 59
59 -
 60
60 -
 61
61 -
 62
62 -
 63
63 -
 64
64 -
 65
65 -
 66
66 -
 67
67 -
 68
68 -
 69
69 -
 70
70 -
 71
71 -
 72
72 -
73
-
74
-
75
-
76
-
77
-
78
-
79
-
80
-
81
-
82
-
83
-
84
-
85
-
86
-
87
-
88
-
89
-
90
-
91
-
92
-
93
-
94
-
95
-
96
-
97
-
98
-
99
-
100
-
101
-
102
-
103
-
104
-
105
-
106
-
107
-
108
-
109
-
110
-
111
-
112
-
113
-
114
-
115
-
116
-
117
-
118
-
119
-
120
-
121
-
122
-
123
-
124
-
125
-
126
-
127
-
128
-
129
-
130
-
131
-
132
-
133
-
134
-
135
-
136
-
137
-
138
-
139
-
140
-
141
-
142
-
143
-
144
-
145
-
146
-
147
-
148
-
149
-
150
-
151
-
152
-
153
-
154
-
155
-
156
-
157
-
158
-
159
-
160
-
161
-
162
-
163
-
164
-
165
-
166
-
167
-
168
-
169
-
170
-
171
-
172
-
173
-
174
-
175
-
176
-
177
-
178
-
179
-
180
-
181
-
182
-
183
-
184
-
185
-
186
-
187
-
188
-
189
-
190
-
191
-
192
-
193
-
194
-
195
-
196
-
197
-
198
-
199
-
200
-
201
-
202
-
203
-
204
-
205
-
206
-
207
-
208
-
209
-
210
-
211
-
212
-
213
-
214
-
215
-
216
-
217
-
218
-
219
-
220
-
221
-
222
-
223
-
224
-
225
-
226
-
227
-
228
-
229
-
230
-
231
-
232
 |
 |
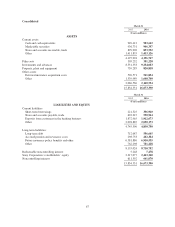
Current Assets
Current assets as of March 31, 2016 were essentially flat at 4,196.7 billion yen. Current assets as of
March 31, 2016 in all segments, excluding the Financial Services segment, decreased by 38.0 billion yen, or
1.3 percent year-on-year, to 2,873.6 billion yen.
Cash and cash equivalents as of March 31, 2016 in all segments, excluding the Financial Services segment,
increased by 8.0 billion yen, or 1.1 percent year-on-year, to 749.9 billion yen. Refer to “Cash Flows” below.
Notes and accounts receivable, trade (net of allowances for doubtful accounts and sales returns) as of
March 31, 2016, excluding the Financial Services segment, decreased by 46.1 billion yen, or 5.2 percent year-on-
year, to 847.8 billion yen. This decrease was primarily due to the impact of foreign exchange rates.
Other current assets as of March 31, 2016 in all segments, excluding the Financial Services segment, were
essentially flat at 1,272.7 billion yen.
Inventories as of March 31, 2016 increased by 17.7 billion yen, or 2.7 percent year-on-year, to 683.1 billion
yen.
Current assets as of March 31, 2016 in the Financial Services segment increased by 39.5 billion yen, or
3.1 percent year-on-year, to 1,328.1 billion yen primarily due to an increase of cash and cash equivalents at Sony
Life and Sony Bank.
Investments and Advances
Investments and advances as of March 31, 2016 increased by 702.7 billion yen, or 8.2 percent year-on-year,
to 9,234.1 billion yen.
Investments and advances as of March 31, 2016 in all segments, excluding the Financial Services segment,
decreased by 86.0 billion yen, or 21.8 percent year-on-year, to 309.2 billion yen. This decrease was primarily due
to the sale of certain shares of Olympus Corporation.
Investments and advances as of March 31, 2016 in the Financial Services segment increased by
787.3 billion yen, or 9.6 percent year-on-year, to 9,005.0 billion yen. This increase was primarily due to an
increase in investments and advances at Sony Life. Refer to “Investments” below.
Property, Plant and Equipment (after deduction of accumulated depreciation)
Property, plant and equipment as of March 31, 2016 increased by 81.5 billion yen, or 11.0 percent year-on-
year, to 820.8 billion yen.
Property, plant and equipment as of March 31, 2016 in all segments, excluding the Financial Services
segment, increased by 80.8 billion yen, or 11.2 percent year-on-year, to 801.5 billion yen. Capital expenditures
(additions to property, plant and equipment) for the fiscal year ended March 31, 2016 in all segments, excluding
the Financial Services segment, increased by 209.0 billion yen, or 127.9 percent year-on-year, to 372.4 billion
yen. This increase was primarily due to an increase in capital expenditure for image sensors production capacity
expansion in the Devices segment.
Property, plant and equipment as of March 31, 2016 in the Financial Services segment increased by
0.7 billion yen, or 4.3 percent year-on-year, to 18.0 billion yen.
Other Assets
Other assets as of March 31, 2016 increased by 60.0 billion yen, or 2.9 percent year-on-year, to
2,120.5 billion yen primarily due to an increase in goodwill. Refer to Note 9 of the consolidated financial
statements.
62