Sony 2015 Annual Report Download - page 85
Download and view the complete annual report
Please find page 85 of the 2015 Sony annual report below. You can navigate through the pages in the report by either clicking on the pages listed below, or by using the keyword search tool below to find specific information within the annual report.-
 1
1 -
2
-
3
-
4
-
5
-
6
-
7
-
8
-
9
-
10
-
11
-
12
-
13
-
14
-
15
-
16
-
17
-
18
-
19
-
20
-
21
-
22
-
23
-
24
-
25
-
26
-
27
-
28
-
29
-
30
-
31
-
32
-
33
-
34
-
35
-
36
-
37
-
38
-
39
-
40
-
41
-
42
-
43
-
44
-
45
-
46
-
47
-
48
-
49
-
50
-
51
-
52
-
53
-
54
-
55
-
56
-
57
-
58
-
59
-
60
-
61
-
62
-
63
-
64
-
65
-
66
-
67
-
68
-
69
-
70
-
71
-
72
-
73
-
74
-
 75
75 -
 76
76 -
 77
77 -
 78
78 -
 79
79 -
 80
80 -
 81
81 -
 82
82 -
 83
83 -
 84
84 -
 85
85 -
 86
86 -
 87
87 -
 88
88 -
 89
89 -
 90
90 -
 91
91 -
 92
92 -
 93
93 -
 94
94 -
 95
95 -
96
-
97
-
98
-
99
-
100
-
101
-
102
-
103
-
104
-
105
-
106
-
107
-
108
-
109
-
110
-
111
-
112
-
113
-
114
-
115
-
116
-
117
-
118
-
119
-
120
-
121
-
122
-
123
-
124
-
125
-
126
-
127
-
128
-
129
-
130
-
131
-
132
-
133
-
134
-
135
-
136
-
137
-
138
-
139
-
140
-
141
-
142
-
143
-
144
-
145
-
146
-
147
-
148
-
149
-
150
-
151
-
152
-
153
-
154
-
155
-
156
-
157
-
158
-
159
-
160
-
161
-
162
-
163
-
164
-
165
-
166
-
167
-
168
-
169
-
170
-
171
-
172
-
173
-
174
-
175
-
176
-
177
-
178
-
179
-
180
-
181
-
182
-
183
-
184
-
185
-
186
-
187
-
188
-
189
-
190
-
191
-
192
-
193
-
194
-
195
-
196
-
197
-
198
-
199
-
200
-
201
-
202
-
203
-
204
-
205
-
206
-
207
-
208
-
209
-
210
-
211
-
212
-
213
-
214
-
215
-
216
-
217
-
218
-
219
-
220
-
221
-
222
-
223
-
224
-
225
-
226
-
227
-
228
-
229
-
230
-
231
-
232
 |
 |

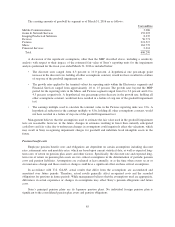
The carrying amounts of goodwill by segment as of March 31, 2016 are as follows:
Yen in millions
Mobile Communications 3,286
Game & Network Services 152,293
Imaging Products & Solutions 8,337
Devices 56,771
Pictures 221,517
Music 161,772
Financial Services 2,314
Total 606,290
A discussion of the significant assumptions, other than the MRP described above, including a sensitivity
analysis with respect to their impact, of the estimated fair value of Sony’s reporting units for the impairment
analysis performed for the fiscal year ended March 31, 2016 is included below:
• The discount rates ranged from 6.3 percent to 10.0 percent. A hypothetical one percentage point
increase in the discount rate, holding all other assumptions constant, would not have resulted in a failure
of step one of the goodwill impairment test.
• The growth rates applied to the terminal values for reporting units within the Electronics segments and
Financial Services ranged from approximately 1.0 to 1.5 percent. The growth rates beyond the MRP
period for the reporting units in the Music and Pictures segment ranged from 0 to 3.0 percent and 4.0 to
4.5 percent, respectively. A hypothetical one percentage point decrease in the growth rate, holding all
other assumptions constant, would not have resulted in a failure of step one of the goodwill impairment
test.
• The earnings multiple used to calculate the terminal value in the Pictures reporting units was 9.0x. A
hypothetical reduction in the earnings multiple to 8.0x, holding all other assumptions constant, would
not have resulted in a failure of step one of the goodwill impairment test.
Management believes that the assumptions used to estimate the fair value used in the goodwill impairment
tests are reasonable; however, in the future, changes in estimates resulting in lower than currently anticipated
cash flows and fair value due to unforeseen changes in assumptions could negatively affect the valuations, which
may result in Sony recognizing impairment charges for goodwill and indefinite lived intangible assets in the
future.
Pension benefit costs
Employee pension benefit costs and obligations are dependent on certain assumptions including discount
rates, retirement rates and mortality rates, which are based upon current statistical data, as well as expected long-
term rates of return on pension plan assets and other factors. Specifically, the discount rate and expected long-
term rate of return on pension plan assets are two critical assumptions in the determination of periodic pension
costs and pension liabilities. Assumptions are evaluated at least annually, or at the time when events occur or
circumstances change and these events or changes could have a significant effect on these critical assumptions.
In accordance with U.S. GAAP, actual results that differ from the assumptions are accumulated and
amortized over future periods. Therefore, actual results generally affect recognized costs and the recorded
obligations for pensions in future periods. While management believes that the assumptions used are appropriate,
differences in actual experience or changes in assumptions may affect Sony’s pension obligations and future
costs.
Sony’s principal pension plans are its Japanese pension plans. No individual foreign pension plan is
significant to the consolidated pension plan assets and pension obligations.
85