Sony 2015 Annual Report Download - page 69
Download and view the complete annual report
Please find page 69 of the 2015 Sony annual report below. You can navigate through the pages in the report by either clicking on the pages listed below, or by using the keyword search tool below to find specific information within the annual report.-
 1
1 -
2
-
3
-
4
-
5
-
6
-
7
-
8
-
9
-
10
-
11
-
12
-
13
-
14
-
15
-
16
-
17
-
18
-
19
-
20
-
21
-
22
-
23
-
24
-
25
-
26
-
27
-
28
-
29
-
30
-
31
-
32
-
33
-
34
-
35
-
36
-
37
-
38
-
39
-
40
-
41
-
42
-
43
-
44
-
45
-
46
-
47
-
48
-
49
-
50
-
51
-
52
-
53
-
54
-
55
-
56
-
57
-
58
-
 59
59 -
 60
60 -
 61
61 -
 62
62 -
 63
63 -
 64
64 -
 65
65 -
 66
66 -
 67
67 -
 68
68 -
 69
69 -
 70
70 -
 71
71 -
 72
72 -
 73
73 -
 74
74 -
 75
75 -
 76
76 -
 77
77 -
 78
78 -
 79
79 -
80
-
81
-
82
-
83
-
84
-
85
-
86
-
87
-
88
-
89
-
90
-
91
-
92
-
93
-
94
-
95
-
96
-
97
-
98
-
99
-
100
-
101
-
102
-
103
-
104
-
105
-
106
-
107
-
108
-
109
-
110
-
111
-
112
-
113
-
114
-
115
-
116
-
117
-
118
-
119
-
120
-
121
-
122
-
123
-
124
-
125
-
126
-
127
-
128
-
129
-
130
-
131
-
132
-
133
-
134
-
135
-
136
-
137
-
138
-
139
-
140
-
141
-
142
-
143
-
144
-
145
-
146
-
147
-
148
-
149
-
150
-
151
-
152
-
153
-
154
-
155
-
156
-
157
-
158
-
159
-
160
-
161
-
162
-
163
-
164
-
165
-
166
-
167
-
168
-
169
-
170
-
171
-
172
-
173
-
174
-
175
-
176
-
177
-
178
-
179
-
180
-
181
-
182
-
183
-
184
-
185
-
186
-
187
-
188
-
189
-
190
-
191
-
192
-
193
-
194
-
195
-
196
-
197
-
198
-
199
-
200
-
201
-
202
-
203
-
204
-
205
-
206
-
207
-
208
-
209
-
210
-
211
-
212
-
213
-
214
-
215
-
216
-
217
-
218
-
219
-
220
-
221
-
222
-
223
-
224
-
225
-
226
-
227
-
228
-
229
-
230
-
231
-
232
 |
 |
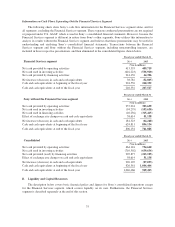
For fixed maturity securities with unrecognized losses held by Sony Life as of March 31, 2016 (0.1 billion
yen), maturity dates vary as follows:
• Within 1 year: 34.4 percent
• 1 to 5 years: —
• 5 to 10 years: —
• above 10 years: 65.6 percent
For fixed maturity securities with unrecognized losses held by Sony Bank as of March 31, 2016 (3.7 billion
yen), maturity dates vary as follows:
• Within 1 year: 18.4 percent
• 1 to 5 years: 46.2 percent
• 5 to 10 years: 35.4 percent
• above 10 years: —
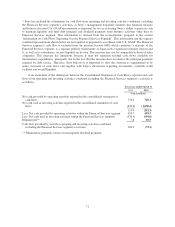
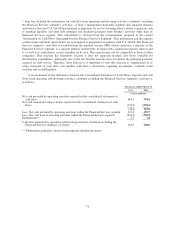
For the fiscal years ended March 31, 2014, 2015 and 2016, Sony Life recorded net realized gains on
available-for-sale securities of 0.4 billion yen, 9.3 billion yen and 19.3 billion yen, respectively.
In the ordinary course of business, Sony maintains long-term investment securities, included in securities
investments and other issued by a number of non-public companies. The aggregate carrying amount of the
investments in non-public companies at March 31, 2016 was 71.8 billion yen. A non-public equity investment is
primarily valued at cost if fair value is not readily determinable. If the value is estimated to have declined and
such decline is judged to be other-than-temporary, the impairment of the investment is recognized immediately
and the carrying value is reduced to its fair value.
For the fiscal years ended March 31, 2014, 2015 and 2016, total realized impairment losses were 1.8 billion
yen, 0.9 billion yen and 3.6 billion yen, respectively, of which 0.2 billion yen, 0.1 billion yen and 0.1 billion yen,
respectively, were recorded in financial services revenue by the subsidiaries in the Financial Services segment.
Realized impairment losses recorded other than by subsidiaries in the Financial Services segment in each of the
three fiscal years were reflected in non-operating expenses and primarily relate to certain strategic investments in
non-Financial Services businesses. These investments primarily relate to certain strategic investments in Japan
and the U.S. with which Sony has strategic relationships for the purposes of developing and marketing new
technologies. Impairment losses were recorded for each of the three fiscal years as certain companies failed to
successfully develop and market such technology, resulting in the operating performance of these companies
being more unfavorable than previously expected. As a result the decline in the fair value of these companies was
judged as other-than-temporary. None of these impairment losses were individually material to Sony.
Upon determination that the value of an investment is impaired, the value of the investment is written down
to its fair value. For an investment where the quoted price is available in an active market, fair value is
determined based on unadjusted quoted prices as of the date on which the impairment determination is made. For
investments where the quoted price is not available in an active market, fair value is usually determined based on
quoted prices of securities with similar characteristics or measured through the use of various methodologies
such as pricing models, discounted cash flow techniques, or similar techniques that require significant
management judgment or estimation of assumptions that market participants would use in pricing the
investments. The impairment losses that were recorded in each of the three fiscal years related to the unique facts
and circumstances of each individual investment and did not significantly impact other investments.
Sony Life and Sony Bank’s investments constitute the majority of the investments in the Financial Services
segment. As of March 31, 2016, Sony Life and Sony Bank account for approximately 92 percent and 6 percent of
the investments in the Financial Services segment, respectively.
Cash Flows
(The fiscal year ended March 31, 2016 compared with the fiscal year ended March 31, 2015)
Operating Activities: During the fiscal year ended March 31, 2016, there was a net cash inflow of
749.1 billion yen from operating activities, a decrease of 5.6 billion yen, or 0.7 percent year-on-year.
69