Sony 2015 Annual Report Download - page 181
Download and view the complete annual report
Please find page 181 of the 2015 Sony annual report below. You can navigate through the pages in the report by either clicking on the pages listed below, or by using the keyword search tool below to find specific information within the annual report.-
 1
1 -
2
-
3
-
4
-
5
-
6
-
7
-
8
-
9
-
10
-
11
-
12
-
13
-
14
-
15
-
16
-
17
-
18
-
19
-
20
-
21
-
22
-
23
-
24
-
25
-
26
-
27
-
28
-
29
-
30
-
31
-
32
-
33
-
34
-
35
-
36
-
37
-
38
-
39
-
40
-
41
-
42
-
43
-
44
-
45
-
46
-
47
-
48
-
49
-
50
-
51
-
52
-
53
-
54
-
55
-
56
-
57
-
58
-
59
-
60
-
61
-
62
-
63
-
64
-
65
-
66
-
67
-
68
-
69
-
70
-
71
-
72
-
73
-
74
-
75
-
76
-
77
-
78
-
79
-
80
-
81
-
82
-
83
-
84
-
85
-
86
-
87
-
88
-
89
-
90
-
91
-
92
-
93
-
94
-
95
-
96
-
97
-
98
-
99
-
100
-
101
-
102
-
103
-
104
-
105
-
106
-
107
-
108
-
109
-
110
-
111
-
112
-
113
-
114
-
115
-
116
-
117
-
118
-
119
-
120
-
121
-
122
-
123
-
124
-
125
-
126
-
127
-
128
-
129
-
130
-
131
-
132
-
133
-
134
-
135
-
136
-
137
-
138
-
139
-
140
-
141
-
142
-
143
-
144
-
145
-
146
-
147
-
148
-
149
-
150
-
151
-
152
-
153
-
154
-
155
-
156
-
157
-
158
-
159
-
160
-
161
-
162
-
163
-
164
-
165
-
166
-
167
-
168
-
169
-
170
-
 171
171 -
 172
172 -
 173
173 -
 174
174 -
 175
175 -
 176
176 -
 177
177 -
 178
178 -
 179
179 -
 180
180 -
 181
181 -
 182
182 -
 183
183 -
 184
184 -
 185
185 -
 186
186 -
 187
187 -
 188
188 -
 189
189 -
 190
190 -
 191
191 -
192
-
193
-
194
-
195
-
196
-
197
-
198
-
199
-
200
-
201
-
202
-
203
-
204
-
205
-
206
-
207
-
208
-
209
-
210
-
211
-
212
-
213
-
214
-
215
-
216
-
217
-
218
-
219
-
220
-
221
-
222
-
223
-
224
-
225
-
226
-
227
-
228
-
229
-
230
-
231
-
232
 |
 |

SONY CORPORATION AND CONSOLIDATED SUBSIDIARIES
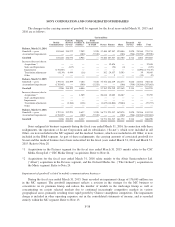
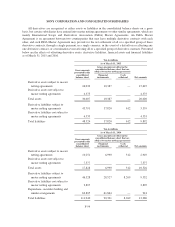
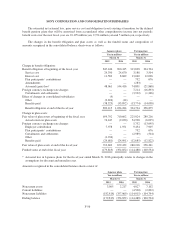
*2 Unrealized gains (losses) are included in unrealized gains (losses) on securities in the consolidated
statements of comprehensive income.
*3 Certain corporate bonds were transferred out of level 3 because quoted prices became available.
*4 Certain corporate bonds were transferred into level 3 because differences between the fair value determined
by indicative quotes from dealers and the fair value determined by internally developed prices became
significant and the observability of the inputs used decreased.
Level 3 assets include certain hybrid financial instruments for which the price fluctuates primarily based on
the main stock index in Japan (Nikkei index), certain private equity investments, and certain domestic and
foreign corporate bonds for which quoted prices are not available in a market and where there is less
transparency around inputs. In determining the fair value of such assets, Sony uses third-party information such
as indicative quotes from dealers without adjustment. For validating the fair values, Sony primarily uses internal
models which include management judgment or estimation of assumptions that market participants would use in
pricing the asset.
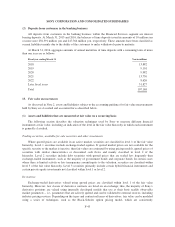
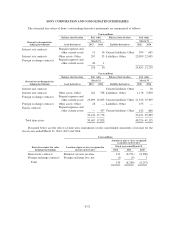
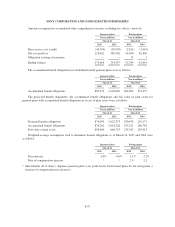
(2) Assets and liabilities that are measured at fair value on a nonrecurring basis
Sony also has assets and liabilities that are required to be remeasured to fair value on a nonrecurring basis
when certain circumstances occur. During the fiscal years ended March 31, 2015 and 2016, such remeasurements
to fair value related primarily to the following:
During the fiscal year ended March 31, 2015
Estimated fair value Amounts
included in
earningsLevel 1 Level 2 Level 3
Assets:
Long-lived assets impairments — — 768 (18,926)
Goodwill impairments — — 0 (177,135)
(196,061)
During the fiscal year ended March 31, 2016
Estimated fair value Amounts
included in
earningsLevel 1 Level 2 Level 3
Assets:
Long-lived assets impairments — — 19,680 (92,544)
(92,544)
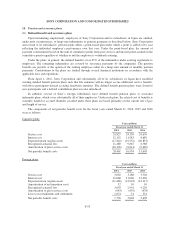
Long-lived assets impairments
Sony recorded impairment losses of 7,798 million yen and 4,929 million yen for the fiscal years ended
March 31, 2014 and 2015, respectively, included within the HE&S segment, related to the LCD television asset
group. These impairment losses primarily reflected a decrease in the estimated fair value of property, plant and
equipment and certain intangible assets. For the LCD television asset group, the corresponding estimated future
cash flows leading to the impairment charge reflected the deterioration in LCD television market conditions in
Japan, Europe and North America, and unfavorable foreign exchange rates.
Sony recorded an impairment loss of 32,107 million yen and 30,643 million yen for the fiscal years ended
March 31, 2014 and 2016, respectively, included within the Devices segment, related to long-lived assets in the
battery business asset group. In the fiscal year ended March 31, 2014, in light of a lack of progress towards
achieving adequate operating results, Sony conducted a strategic review of the business and evolving market
trends. Sony reduced the corresponding estimated future cash flows and the estimated ability to recover the entire
F-47