Sony 2015 Annual Report Download - page 73
Download and view the complete annual report
Please find page 73 of the 2015 Sony annual report below. You can navigate through the pages in the report by either clicking on the pages listed below, or by using the keyword search tool below to find specific information within the annual report.-
 1
1 -
2
-
3
-
4
-
5
-
6
-
7
-
8
-
9
-
10
-
11
-
12
-
13
-
14
-
15
-
16
-
17
-
18
-
19
-
20
-
21
-
22
-
23
-
24
-
25
-
26
-
27
-
28
-
29
-
30
-
31
-
32
-
33
-
34
-
35
-
36
-
37
-
38
-
39
-
40
-
41
-
42
-
43
-
44
-
45
-
46
-
47
-
48
-
49
-
50
-
51
-
52
-
53
-
54
-
55
-
56
-
57
-
58
-
59
-
60
-
61
-
62
-
 63
63 -
 64
64 -
 65
65 -
 66
66 -
 67
67 -
 68
68 -
 69
69 -
 70
70 -
 71
71 -
 72
72 -
 73
73 -
 74
74 -
 75
75 -
 76
76 -
 77
77 -
 78
78 -
 79
79 -
 80
80 -
 81
81 -
 82
82 -
 83
83 -
84
-
85
-
86
-
87
-
88
-
89
-
90
-
91
-
92
-
93
-
94
-
95
-
96
-
97
-
98
-
99
-
100
-
101
-
102
-
103
-
104
-
105
-
106
-
107
-
108
-
109
-
110
-
111
-
112
-
113
-
114
-
115
-
116
-
117
-
118
-
119
-
120
-
121
-
122
-
123
-
124
-
125
-
126
-
127
-
128
-
129
-
130
-
131
-
132
-
133
-
134
-
135
-
136
-
137
-
138
-
139
-
140
-
141
-
142
-
143
-
144
-
145
-
146
-
147
-
148
-
149
-
150
-
151
-
152
-
153
-
154
-
155
-
156
-
157
-
158
-
159
-
160
-
161
-
162
-
163
-
164
-
165
-
166
-
167
-
168
-
169
-
170
-
171
-
172
-
173
-
174
-
175
-
176
-
177
-
178
-
179
-
180
-
181
-
182
-
183
-
184
-
185
-
186
-
187
-
188
-
189
-
190
-
191
-
192
-
193
-
194
-
195
-
196
-
197
-
198
-
199
-
200
-
201
-
202
-
203
-
204
-
205
-
206
-
207
-
208
-
209
-
210
-
211
-
212
-
213
-
214
-
215
-
216
-
217
-
218
-
219
-
220
-
221
-
222
-
223
-
224
-
225
-
226
-
227
-
228
-
229
-
230
-
231
-
232
 |
 |
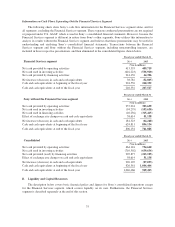
positive impact of a year-on-year improvement in net income after taking into account non-cash adjustments
(including depreciation and amortization, other operating expense, net, deferred income taxes and equity in net
loss of affiliated companies). In addition, there was the positive impact of factors such as a larger decrease in
inventories, and decreases in notes and accounts receivable, trade, compared to increases in the fiscal year ended
March 31, 2014, partially offset by the negative impact of factors such as decreases in notes and accounts
payable, trade, compared to an increase in the fiscal year ended March 31, 2014. The Financial Services segment
had a net cash inflow of 459.7 billion yen, an increase of 46.2 billion yen, or 11.2 percent year-on-year. This
increase was primarily due to an increase of insurance premium revenue in line with an expansion in policy
amount in force at Sony Life.
Investing Activities: During the fiscal year ended March 31, 2015, Sony used 639.6 billion yen of net cash
in investing activities, a decrease of 70.9 billion yen, or 10.0 percent year-on-year.
For all segments excluding the Financial Services segment, there was a net cash outflow of 103.6 billion
yen, an increase of 9.4 billion yen, or 9.9 percent year-on-year. This increase was primarily due to a year-on-year
decrease in proceeds from the sales of fixed assets and investment securities. Sales of fixed assets and investment
securities in the fiscal year ended March 31,2015 included the intersegment sale of Sony Corporation’s
headquarters’ land to Sony Life, the sale of certain buildings and premises at the Gotenyama Technology Center
and the sale of Sony’s shares in SQUARE ENIX HOLDINGS CO., LTD.
The Financial Services segment used 536.9 billion yen of net cash, a decrease of 79.3 billion yen, or
12.9 percent year-on-year. This decrease was mainly due to a year-on-year decrease in payments for investments
and advances at Sony Life and a year-on-year increase in proceeds from the sale of investment securities. This
decrease was partially offset by the negative impact of the intersegment purchase of Sony Corporation’s
headquarters’ land by Sony Life, which is eliminated in the consolidated financial statements.
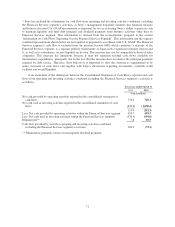
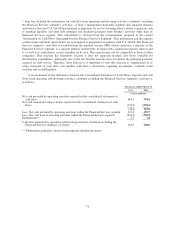
In all segments excluding the Financial Services segment, net cash generated in operating and investing
activities combined* for the fiscal year ended March 31, 2015 was 200.0 billion yen, an increase of 37.1 billion
yen, or 22.8 percent year-on-year.
Financing Activities: During the fiscal year ended March 31, 2015, 263.2 billion yen of net cash and cash
equivalents was used in financing activities, compared to 207.9 billion yen of net cash and cash equivalents
provided in the fiscal year ended March 31, 2014.
For all segments excluding the Financial Services segment, there was a 315.4 billion yen net cash outflow,
an increase of 275.2 billion yen, or 683.9 percent year-on-year. This increase was primarily due to an issuance of
straight bonds for Japanese retail investors in the fiscal year ended March 31, 2014 and a year-on-year increase in
repayments of long-term debt, net.
In the Financial Services segment, financing activities provided 44.4 billion yen of net cash, a decrease of
197.1 billion yen, or 81.6 percent year-on-year. This decrease was mainly due to a smaller increase in customer
deposits at Sony Life, compared to the figure in the fiscal year ended March 31, 2014.
Total Cash and Cash Equivalents: Accounting for the above factors and the effect of fluctuations in foreign
exchange rates, the total outstanding balance of cash and cash equivalents at March 31, 2015 was 949.4 billion yen.
Cash and cash equivalents of all segments excluding the Financial Services segment was 741.9 billion yen at
March 31, 2015, a decrease of 64.2 billion yen, or 8.0 percent compared with the balance as of March 31, 2014. In
order to manage cash balance globally, Sony utilizes a system in which cash surpluses among subsidiaries are
deposited with SGTS and cash shortfalls are covered by loans through SGTS. Sony’s ability to repatriate cash held
in foreign subsidiaries may be restricted or delayed by local laws; however, any such amounts are considered
insignificant. Refer to Cash Management in Item 5 B. Liquidity and Capital Resources. Sony believes that it
continues to maintain sufficient liquidity through access to a total, translated into yen, of 776.6 billion yen of unused
committed lines of credit with financial institutions in addition to the cash and cash equivalents balance at
March 31, 2015. Within the Financial Services segment, the outstanding balance of cash and cash equivalents was
207.5 billion yen at March 31, 2015, a decrease of 32.8 billion yen, or 13.6 percent compared with the balance as of
March 31, 2014.
73