Sony 2015 Annual Report Download - page 45
Download and view the complete annual report
Please find page 45 of the 2015 Sony annual report below. You can navigate through the pages in the report by either clicking on the pages listed below, or by using the keyword search tool below to find specific information within the annual report.-
 1
1 -
2
-
3
-
4
-
5
-
6
-
7
-
8
-
9
-
10
-
11
-
12
-
13
-
14
-
15
-
16
-
17
-
18
-
19
-
20
-
21
-
22
-
23
-
24
-
25
-
26
-
27
-
28
-
29
-
30
-
31
-
32
-
33
-
34
-
 35
35 -
 36
36 -
 37
37 -
 38
38 -
 39
39 -
 40
40 -
 41
41 -
 42
42 -
 43
43 -
 44
44 -
 45
45 -
 46
46 -
 47
47 -
 48
48 -
 49
49 -
 50
50 -
 51
51 -
 52
52 -
 53
53 -
 54
54 -
 55
55 -
56
-
57
-
58
-
59
-
60
-
61
-
62
-
63
-
64
-
65
-
66
-
67
-
68
-
69
-
70
-
71
-
72
-
73
-
74
-
75
-
76
-
77
-
78
-
79
-
80
-
81
-
82
-
83
-
84
-
85
-
86
-
87
-
88
-
89
-
90
-
91
-
92
-
93
-
94
-
95
-
96
-
97
-
98
-
99
-
100
-
101
-
102
-
103
-
104
-
105
-
106
-
107
-
108
-
109
-
110
-
111
-
112
-
113
-
114
-
115
-
116
-
117
-
118
-
119
-
120
-
121
-
122
-
123
-
124
-
125
-
126
-
127
-
128
-
129
-
130
-
131
-
132
-
133
-
134
-
135
-
136
-
137
-
138
-
139
-
140
-
141
-
142
-
143
-
144
-
145
-
146
-
147
-
148
-
149
-
150
-
151
-
152
-
153
-
154
-
155
-
156
-
157
-
158
-
159
-
160
-
161
-
162
-
163
-
164
-
165
-
166
-
167
-
168
-
169
-
170
-
171
-
172
-
173
-
174
-
175
-
176
-
177
-
178
-
179
-
180
-
181
-
182
-
183
-
184
-
185
-
186
-
187
-
188
-
189
-
190
-
191
-
192
-
193
-
194
-
195
-
196
-
197
-
198
-
199
-
200
-
201
-
202
-
203
-
204
-
205
-
206
-
207
-
208
-
209
-
210
-
211
-
212
-
213
-
214
-
215
-
216
-
217
-
218
-
219
-
220
-
221
-
222
-
223
-
224
-
225
-
226
-
227
-
228
-
229
-
230
-
231
-
232
 |
 |

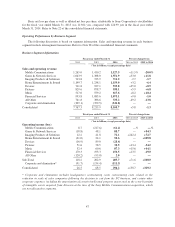
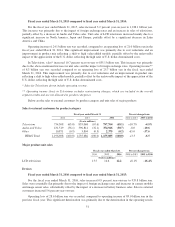
Restructuring charges, net, increased 17.4 billion yen year-on-year to 98.0 billion yen. PC exit costs
decreased 18.7 billion yen year-on-year to 39.6 billion yen, which included 19.6 billion yen of restructuring
charges. The following table provides PC exit costs and the total PC business operating loss for the fiscal year
ended March 31, 2015.
All Other
Corporate and
Elimination
Consolidated
Total
Year-on-year
change
(Yen in billions)
(I) Restructuring charges 11.8 7.8 19.6 -21.3
(II) Other service costs etc.* 20.0 — 20.0 +2.6
PC exit costs (I+II) 31.8 7.8 39.6 -18.7
Operating loss excluding exit costs** (23.9) — (23.9) +9.4
Total PC operating loss (55.7) (7.8) (63.5) +28.2
* Other service costs etc. is primarily comprised of payroll and personnel expenses related to the customer
support activities of the PC business.
** Operating loss excluding exit costs includes sales company fixed costs charged to the PC business in the fiscal
year ended March 31, 2015, which were allocated based on historical results.
Other Income and Expenses
Fiscal year ended March 31, 2016 compared to fiscal year ended March 31, 2015:
For the fiscal year ended March 31, 2016, other income increased by 41.8 billion yen, or 166.6 percent year-
on-year, to 66.8 billion yen, while other expenses increased by 2.6 billion yen, or 4.9 percent year-on-year, to
56.5 billion yen. The net amount of other income and other expenses was income of 10.3 billion yen, an
improvement of 39.1 billion yen year-on-year. This was mainly due to an increase in the gain on securities
investments. The gain on sales of securities investments in the fiscal year ended March 31, 2016 included a
46.8 billion yen gain on the sale of certain shares of Olympus Corporation and a 2.7 billion yen gain on the sale
of shares in connection with the above-mentioned formation of a logistics joint venture. The gain on sales of
securities investments in the previous fiscal year included a 4.8 billion yen gain on Sony’s shares in SQUARE
ENIX HOLDINGS CO., LTD.
The foreign exchange loss, net, was 20.6 billion yen, essentially flat year-on-year. Interest and dividends in
other income of 12.5 billion yen were recorded in the fiscal year ended March 31, 2016, a decrease of 0.4 billion
yen, or 3.4 percent year-on-year. Interest recorded in other expenses totaled 25.3 billion yen, an increase of
1.7 billion yen, or 7.1 percent year-on-year.
Fiscal year ended March 31, 2015 compared to fiscal year ended March 31, 2014:
For the fiscal year ended March 31, 2015, other income decreased by 17.4 billion yen, or 40.9 percent year-
on-year, to 25.1 billion yen, while other expenses increased by 10.7 billion yen, or 24.7 percent year-on-year, to
53.9 billion yen. The net amount of other income and other expenses was an expense of 28.8 billion yen, a
deterioration of 28.1 billion yen year-on-year primarily due to an increase in foreign exchange loss, net, and a
decrease in the gain on sales of securities investments, while a 7.4 billion yen gain on the sale of Sony’s shares in
SKY Perfect JSAT Holdings Inc., which were sold in December 2013, was recorded in the fiscal year ended
March 31, 2014.
The foreign exchange loss, net, increased by 11.3 billion yen, or 122.6 percent year-on-year, to 20.5 billion
yen. This deterioration was mainly due to significant strengthening of the U.S. dollar, particularly in the second half
of the fiscal year ended March 31, 2015, partially offset by routine derivative contracts for forecasted transactions.
Interest and dividends in other income of 12.9 billion yen were recorded in the fiscal year ended March 31,
2015, a decrease of 3.8 billion yen, or 22.6 percent year-on-year. Interest recorded in other expenses totaled
23.6 billion yen, an increase of 0.1 billion yen, or 0.6 percent year-on-year.
45