BB&T 2009 Annual Report Download - page 109
Download and view the complete annual report
Please find page 109 of the 2009 BB&T annual report below. You can navigate through the pages in the report by either clicking on the pages listed below, or by using the keyword search tool below to find specific information within the annual report.-
 1
1 -
2
-
3
-
4
-
5
-
6
-
7
-
8
-
9
-
10
-
11
-
12
-
13
-
14
-
15
-
16
-
17
-
18
-
19
-
20
-
21
-
22
-
23
-
24
-
25
-
26
-
27
-
28
-
29
-
30
-
31
-
32
-
33
-
34
-
35
-
36
-
37
-
38
-
39
-
40
-
41
-
42
-
43
-
44
-
45
-
46
-
47
-
48
-
49
-
50
-
51
-
52
-
53
-
54
-
55
-
56
-
57
-
58
-
59
-
60
-
61
-
62
-
63
-
64
-
65
-
66
-
67
-
68
-
69
-
70
-
71
-
72
-
73
-
74
-
75
-
76
-
77
-
78
-
79
-
80
-
81
-
82
-
83
-
84
-
85
-
86
-
87
-
88
-
89
-
90
-
91
-
92
-
93
-
94
-
95
-
96
-
97
-
98
-
 99
99 -
 100
100 -
 101
101 -
 102
102 -
 103
103 -
 104
104 -
 105
105 -
 106
106 -
 107
107 -
 108
108 -
 109
109 -
 110
110 -
 111
111 -
 112
112 -
 113
113 -
 114
114 -
 115
115 -
 116
116 -
 117
117 -
 118
118 -
 119
119 -
120
-
121
-
122
-
123
-
124
-
125
-
126
-
127
-
128
-
129
-
130
-
131
-
132
-
133
-
134
-
135
-
136
-
137
-
138
-
139
-
140
-
141
-
142
-
143
-
144
-
145
-
146
-
147
-
148
-
149
-
150
-
151
-
152
-
153
-
154
-
155
-
156
-
157
-
158
-
159
-
160
-
161
-
162
-
163
-
164
-
165
-
166
-
167
-
168
-
169
-
170
 |
 |

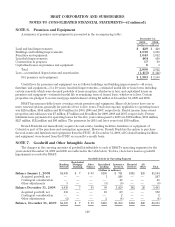
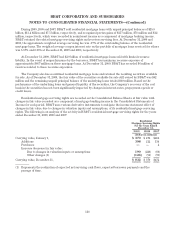
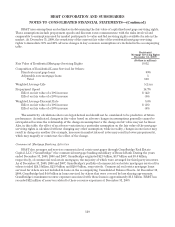
BB&T CORPORATION AND SUBSIDIARIES
NOTES TO CONSOLIDATED FINANCIAL STATEMENTS—(Continued)
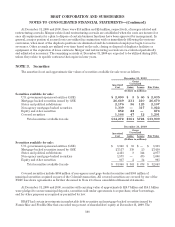
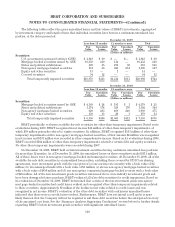
Fannie Mae investments had total amortized cost and fair values of $18.1 billion at December 31, 2009, while
Freddie Mac investments had total amortized cost and fair values of $7.4 billion.
At December 31, 2009, non-agency mortgage-backed securities primarily consisted of residential mortgage-
backed securities. Equity securities include investments in stock issued by the FHLB of Atlanta. At
December 31, 2009 and 2008, BB&T held $656 million and $479 million, respectively, of investments in FHLB
stock.
The gross realized gains and losses and other than temporary impairments recognized in net income during
2009, 2008 and 2007 are reflected in the following table:
As of December 31
2009 2008 2007
Gross gains $241 $ 244 $ 22
Gross losses (1) (33) (25)
Net realized gains/(losses) 240 211 (3)
OTTI recognized in net income (41) (104) —
Net securities gains/(losses) $199 $ 107 $ (3)
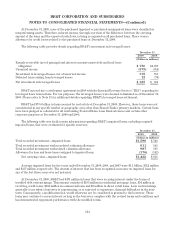
The amortized cost and estimated fair value of the debt securities portfolio at December 31, 2009, by
contractual maturity, are shown in the accompanying table. The expected life of mortgage-backed securities will
differ from contractual maturities because borrowers may have the right to call or prepay the underlying
mortgage loans with or without call or prepayment penalties. For purposes of the maturity table, mortgage-
backed securities, which are not due at a single maturity date, have been included in maturity groupings based on
the contractual maturity.
December 31, 2009
Available for Sale
Amortized
Cost Fair
Value
(Dollars in millions)
Debt Securities:
Due in one year or less $ 156 $ 157
Due after one year through five years 164 168
Due after five years through ten years 3,662 3,661
Due after ten years 29,431 29,043
Total debt securities 33,413 33,029
Total securities with no stated maturity 859 880
Total securities $34,272 $33,909
109