BB&T 2009 Annual Report Download - page 127
Download and view the complete annual report
Please find page 127 of the 2009 BB&T annual report below. You can navigate through the pages in the report by either clicking on the pages listed below, or by using the keyword search tool below to find specific information within the annual report.-
 1
1 -
2
-
3
-
4
-
5
-
6
-
7
-
8
-
9
-
10
-
11
-
12
-
13
-
14
-
15
-
16
-
17
-
18
-
19
-
20
-
21
-
22
-
23
-
24
-
25
-
26
-
27
-
28
-
29
-
30
-
31
-
32
-
33
-
34
-
35
-
36
-
37
-
38
-
39
-
40
-
41
-
42
-
43
-
44
-
45
-
46
-
47
-
48
-
49
-
50
-
51
-
52
-
53
-
54
-
55
-
56
-
57
-
58
-
59
-
60
-
61
-
62
-
63
-
64
-
65
-
66
-
67
-
68
-
69
-
70
-
71
-
72
-
73
-
74
-
75
-
76
-
77
-
78
-
79
-
80
-
81
-
82
-
83
-
84
-
85
-
86
-
87
-
88
-
89
-
90
-
91
-
92
-
93
-
94
-
95
-
96
-
97
-
98
-
99
-
100
-
101
-
102
-
103
-
104
-
105
-
106
-
107
-
108
-
109
-
110
-
111
-
112
-
113
-
114
-
115
-
116
-
 117
117 -
 118
118 -
 119
119 -
 120
120 -
 121
121 -
 122
122 -
 123
123 -
 124
124 -
 125
125 -
 126
126 -
 127
127 -
 128
128 -
 129
129 -
 130
130 -
 131
131 -
 132
132 -
 133
133 -
 134
134 -
 135
135 -
 136
136 -
 137
137 -
138
-
139
-
140
-
141
-
142
-
143
-
144
-
145
-
146
-
147
-
148
-
149
-
150
-
151
-
152
-
153
-
154
-
155
-
156
-
157
-
158
-
159
-
160
-
161
-
162
-
163
-
164
-
165
-
166
-
167
-
168
-
169
-
170
 |
 |

BB&T CORPORATION AND SUBSIDIARIES
NOTES TO CONSOLIDATED FINANCIAL STATEMENTS—(Continued)
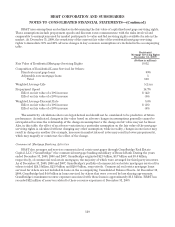
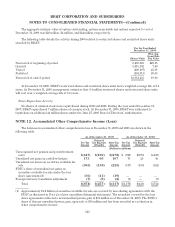
BB&T measures the fair value of restricted shares based on the price of BB&T’s common stock on the grant
date and the fair value of restricted share units based on the price of BB&T’s common stock on the grant date less
the present value of expected dividends that are foregone during the vesting period.
BB&T recorded $62 million, $75 million and $70 million in equity-based compensation in 2009, 2008 and 2007,
respectively. In connection with this compensation expense, BB&T recorded an income tax benefit of $24 million,
$29 million and $27 million in 2009, 2008 and 2007, respectively. The total intrinsic value of options exercised or
restricted share units vested during 2009, 2008 and 2007 was $6 million, $20 million and $37 million, respectively.
The total grant date fair value of equity-based awards that vested during 2009 was $35 million. As of
December 31, 2009, there was $84 million of unrecognized compensation costs related to BB&T’s equity-based
awards that is expected to be recognized over a weighted-average life of 2.8 years.
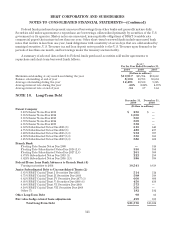
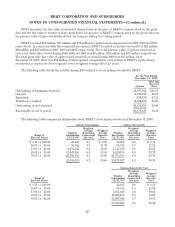
The following table details the activity during 2009 related to stock options awarded by BB&T:
For the Year Ended
December 31, 2009
Options
Wtd. Avg.
Exercise
Price
Outstanding at beginning of period 41,837,504 $36.55
Granted 2,832,038 16.89
Exercised (330,837) 27.11
Forfeited or expired (1,802,886) 35.28
Outstanding at end of period 42,535,819 35.40
Exercisable at end of period 29,878,347 36.31
The following tables summarize information about BB&T’s stock option awards as of December 31, 2009:
Range of
Exercise Prices
Options Outstanding Options Exercisable
Number
Outstanding
12/31/09
Weighted-
Average
Remaining
Contractual
Life (yrs)
Weighted-
Average
Exercise
Price
Number
Exercisable
12/31/09
Weighted-
Average
Remaining
Contractual
Life (yrs)
Weighted-
Average
Exercise
Price
$ 8.11 to $10.00 22,055 0.8 $ 8.58 22,055 0.8 $ 8.58
10.01 to 15.00 54,512 1.5 11.92 54,512 1.5 11.92
15.01 to 25.00 4,471,582 6.2 19.39 1,517,050 0.6 23.45
25.01 to 35.00 11,047,955 6.0 33.36 6,529,135 4.5 32.71
35.01 to 44.20 26,939,715 4.8 38.96 21,755,595 4.4 38.38
42,535,819 5.2 35.40 29,878,347 4.2 36.31
Range of
Exercise Prices
Options Expected to Vest
Number
Outstanding
12/31/09
Weighted-
Average
Remaining
Contractual
Life (yrs)
Weighted-
Average
Exercise
Price
$ 8.11 to $10.00 22,055 0.8 $ 8.58
10.01 to 15.00 54,512 1.5 11.92
15.01 to 25.00 3,954,049 5.8 19.64
25.01 to 35.00 10,088,166 5.8 33.27
35.01 to 44.20 25,397,940 4.7 38.81
39,516,722 5.1 35.42
127