BB&T 2009 Annual Report Download - page 60
Download and view the complete annual report
Please find page 60 of the 2009 BB&T annual report below. You can navigate through the pages in the report by either clicking on the pages listed below, or by using the keyword search tool below to find specific information within the annual report.-
 1
1 -
2
-
3
-
4
-
5
-
6
-
7
-
8
-
9
-
10
-
11
-
12
-
13
-
14
-
15
-
16
-
17
-
18
-
19
-
20
-
21
-
22
-
23
-
24
-
25
-
26
-
27
-
28
-
29
-
30
-
31
-
32
-
33
-
34
-
35
-
36
-
37
-
38
-
39
-
40
-
41
-
42
-
43
-
44
-
45
-
46
-
47
-
48
-
49
-
 50
50 -
 51
51 -
 52
52 -
 53
53 -
 54
54 -
 55
55 -
 56
56 -
 57
57 -
 58
58 -
 59
59 -
 60
60 -
 61
61 -
 62
62 -
 63
63 -
 64
64 -
 65
65 -
 66
66 -
 67
67 -
 68
68 -
 69
69 -
 70
70 -
71
-
72
-
73
-
74
-
75
-
76
-
77
-
78
-
79
-
80
-
81
-
82
-
83
-
84
-
85
-
86
-
87
-
88
-
89
-
90
-
91
-
92
-
93
-
94
-
95
-
96
-
97
-
98
-
99
-
100
-
101
-
102
-
103
-
104
-
105
-
106
-
107
-
108
-
109
-
110
-
111
-
112
-
113
-
114
-
115
-
116
-
117
-
118
-
119
-
120
-
121
-
122
-
123
-
124
-
125
-
126
-
127
-
128
-
129
-
130
-
131
-
132
-
133
-
134
-
135
-
136
-
137
-
138
-
139
-
140
-
141
-
142
-
143
-
144
-
145
-
146
-
147
-
148
-
149
-
150
-
151
-
152
-
153
-
154
-
155
-
156
-
157
-
158
-
159
-
160
-
161
-
162
-
163
-
164
-
165
-
166
-
167
-
168
-
169
-
170
 |
 |

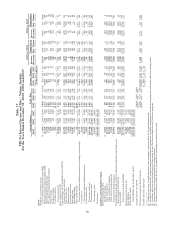
Table 17
FTE Net Interest Income and Rate / Volume Analysis
For the Years Ended December 31, 2009, 2008 and 2007
2009 vs. 2008 2008 vs. 2007
Average Balances Yield / Rate Income / Expense Increase
(Decrease)
Change due to Increase
(Decrease)
Change due to
2009 2008 2007 2009 2008 2007 2009 2008 2007 Rate Volume Rate Volume
(Dollars in millions)
Assets
Securities, at amortized cost (1):
U.S. government-sponsored entities (GSE) $ 1,400 $ 4,539 $ 10,099 3.86% 4.86% 4.53% $54$ 221 $ 458 $(167) $(39) (128) $(237) $31 $(268)
Mortgage-backed securities issued by GSE 25,419 14,708 8,265 4.14 4.94 5.15 1,052 727 425 325 (133) 458 302 (18) 320
States and political subdivisions 2,218 1,841 873 5.67 6.33 6.65 126 116 58 10 (13) 23 58 (3) 61
Non-agency mortgage-backed securities 1,447 1,642 1,669 5.82 5.81 5.78 84 95 96 (11) — (11) (1) 1 (2)
Other securities 849 1,138 1,182 1.58 4.72 7.04 14 54 83 (40) (29) (11) (29) (25) (4)
Trading securities 523 629 1,223 1.74 3.80 4.62 924 57 (15) (11) (4) (33) (9) (24)
Covered securities 440 ——11.35 —— 50 —— 50 —50 — ——
Total securities (5) 32,296 24,497 23,311 4.30 5.05 5.05 1,389 1,237 1,177 152 (225) 377 60 (23) 83
Other earning assets (2) 1,223 1,160 1,042 .60 2.43 4.88 728 51 (21) (22) 1 (23) (29) 6
Loans and leases, net of unearned income (1)(3)(4)
Commercial loans and leases 50,074 47,557 42,472 4.21 5.50 7.76 2,110 2,617 3,296 (507) (640) 133 (679) (1,040) 361
Direct retail loans 14,730 15,580 15,471 5.47 6.47 7.36 806 1,008 1,139 (202) (150) (52) (131) (139) 8
Sales finance loans 6,392 6,216 5,903 6.46 6.62 6.66 413 412 393 1(10) 11 19 (2) 21
Revolving credit loans 1,855 1,664 1,460 9.51 10.95 12.97 176 182 189 (6) (25) 19 (7) (32) 25
Mortgage loans 15,927 17,327 16,572 5.72 6.00 5.98 911 1,039 992 (128) (46) (82) 47 3 44
Specialized lending 7,141 5,509 5,130 11.51 12.89 13.30 822 710 682 112 (82) 194 28 (21) 49
Other acquired loans 52 ——10.81 —— 6—— 6—6 ———
Total loans and leases held for investment (excluding covered loans) 96,171 93,853 87,008 5.45 6.36 7.69 5,244 5,968 6,691 (724) (953) 229 (723) (1,231) 508
Covered loans 3,144 ——7.39 —— 232 —— 232 — 232 — — —
Total loans and leases held for investment 99,315 93,853 87,008 5.51 6.36 7.69 5,476 5,968 6,691 (492) (953) 461 (723) (1,231) 508
Loans held for sale 2,831 1,342 944 4.81 5.92 6.14 136 80 58 56 (17) 73 22 (2) 24
Total loans and leases 102,146 95,195 87,952 5.49 6.35 7.67 5,612 6,048 6,749 (436) (970) 534 (701) (1,233) 532
Total earning assets 135,665 120,852 112,305 5.17 6.05 7.10 7,008 7,313 7,977 (305) (1,217) 912 (664) (1,285) 621
Non-earning assets 19,517 16,029 14,115
Total assets $155,182 $136,881 $126,420
Liabilities and Shareholders’ Equity
Interest-bearing deposits:
Interest-checking $ 2,831 2,376 $ 2,297 .39 1.19 2.31 11 28 53 (17) (22) 5 (25) (27) 2
Other client deposits 45,107 36,676 34,273 .88 1.67 2.82 398 612 968 (214) (335) 121 (356) (420) 64
Client certificates of deposits 28,702 26,908 26,039 2.60 3.66 4.61 747 985 1,201 (238) (301) 63 (216) (255) 39
Other interest-bearing deposits 9,354 9,810 7,741 1.23 2.71 5.15 115 266 398 (151) (139) (12) (132) (220) 88
Total interest-bearing deposits 85,994 75,770 70,350 1.48 2.50 3.73 1,271 1,891 2,620 (620) (797) 177 (729) (922) 193
Federal funds purchased, securities sold under repurchase agreements and
short-term borrowed funds (1) 12,491 10,580 9,325 .50 2.44 4.55 63 258 424 (195) (235) 40 (166) (217) 51
Long-term debt 19,085 19,839 18,045 3.73 4.25 5.46 711 843 985 (132) (100) (32) (142) (233) 91
Total interest-bearing liabilities 117,570 106,189 97,720 1.74 2.82 4.12 2,045 2,992 4,029 (947) (1,132) 185 (1,037) (1,372) 335
Noninterest-bearing deposits 16,387 13,061 13,151
Other liabilities 4,987 4,098 3,334
Shareholders’ equity 16,238 13,533 12,215
Total liabilities and shareholders’ equity $155,182 $136,881 $126,420
Average interest rate spread 3.43% 3.23% 2.98%
Net interest margin/net interest income 3.66% 3.58% 3.52% $4,963 $4,321 $3,948 $ 642 $(85) $727 $ 373 $87 $ 286
Taxable equivalent adjustment $ 119 $83$68
(1) Yields are stated on a taxable equivalent basis assuming tax rates in effect for the periods presented.
(2) Includes Federal funds sold, securities purchased under resale agreements or similar arrangements, interest-bearing deposits with banks, and other earning assets.
(3) Loan fees, which are not material for any of the periods shown, have been included for rate calculation purposes.
(4) Nonaccrual loans have been included in the average balances.
(5) Includes securities available for sale at amortized cost and trading securities at fair value.
60