BB&T 2009 Annual Report Download - page 89
Download and view the complete annual report
Please find page 89 of the 2009 BB&T annual report below. You can navigate through the pages in the report by either clicking on the pages listed below, or by using the keyword search tool below to find specific information within the annual report.-
 1
1 -
2
-
3
-
4
-
5
-
6
-
7
-
8
-
9
-
10
-
11
-
12
-
13
-
14
-
15
-
16
-
17
-
18
-
19
-
20
-
21
-
22
-
23
-
24
-
25
-
26
-
27
-
28
-
29
-
30
-
31
-
32
-
33
-
34
-
35
-
36
-
37
-
38
-
39
-
40
-
41
-
42
-
43
-
44
-
45
-
46
-
47
-
48
-
49
-
50
-
51
-
52
-
53
-
54
-
55
-
56
-
57
-
58
-
59
-
60
-
61
-
62
-
63
-
64
-
65
-
66
-
67
-
68
-
69
-
70
-
71
-
72
-
73
-
74
-
75
-
76
-
77
-
78
-
 79
79 -
 80
80 -
 81
81 -
 82
82 -
 83
83 -
 84
84 -
 85
85 -
 86
86 -
 87
87 -
 88
88 -
 89
89 -
 90
90 -
 91
91 -
 92
92 -
 93
93 -
 94
94 -
 95
95 -
 96
96 -
 97
97 -
 98
98 -
 99
99 -
100
-
101
-
102
-
103
-
104
-
105
-
106
-
107
-
108
-
109
-
110
-
111
-
112
-
113
-
114
-
115
-
116
-
117
-
118
-
119
-
120
-
121
-
122
-
123
-
124
-
125
-
126
-
127
-
128
-
129
-
130
-
131
-
132
-
133
-
134
-
135
-
136
-
137
-
138
-
139
-
140
-
141
-
142
-
143
-
144
-
145
-
146
-
147
-
148
-
149
-
150
-
151
-
152
-
153
-
154
-
155
-
156
-
157
-
158
-
159
-
160
-
161
-
162
-
163
-
164
-
165
-
166
-
167
-
168
-
169
-
170
 |
 |

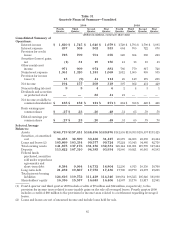
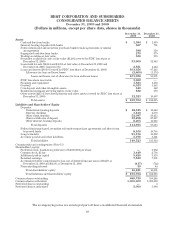
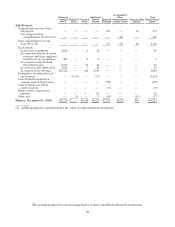
BB&T CORPORATION AND SUBSIDIARIES
CONSOLIDATED BALANCE SHEETS
December 31, 2009 and 2008
(Dollars in millions, except per share data, shares in thousands)
December 31,
2009 December 31,
2008
Assets
Cash and due from banks $ 1,584 $ 1,639
Interest-bearing deposits with banks 667 751
Federal funds sold and securities purchased under resale agreements or similar
arrangements 398 350
Segregated cash due from banks 270 379
Trading securities at fair value 636 376
Securities available for sale at fair value ($1,201 covered by FDIC loss share at
December 31, 2009) 33,909 32,843
Loans held for sale ($2,551 and $1,396 at fair value at December 31, 2009 and
December 31, 2008, respectively) 2,551 1,424
Loans and leases ($8,019 covered by FDIC loss share at December 31, 2009) 103,656 97,245
Allowance for loan and lease losses (2,600) (1,574)
Loans and leases, net of allowance for loan and lease losses 101,056 95,671
FDIC loss share receivable 3,062 —
Premises and equipment 1,583 1,580
Goodwill 6,053 5,483
Core deposit and other intangible assets 640 542
Residential mortgage servicing rights at fair value 832 370
Other assets ($215 of foreclosed property and other assets covered by FDIC loss share at
December 31, 2009) 12,523 10,607
Total assets $ 165,764 $ 152,015
Liabilities and Shareholders’ Equity
Deposits:
Noninterest-bearing deposits $ 18,945 $ 13,649
Interest checking 3,420 2,576
Other client deposits 52,097 39,413
Client certificates of deposit 32,298 27,937
Other interest-bearing deposits 8,205 15,038
Total deposits 114,965 98,613
Federal funds purchased, securities sold under repurchase agreements and short-term
borrowed funds 8,106 10,788
Long-term debt 21,376 18,032
Accounts payable and other liabilities 5,076 8,501
Total liabilities 149,523 135,934
Commitments and contingencies (Note 15)
Shareholders’ equity:
Preferred stock, liquidation preference of $1,000,000 per share —3,082
Common stock, $5 par 3,449 2,796
Additional paid-in capital 5,620 3,510
Retained earnings 7,539 7,381
Accumulated other comprehensive loss, net of deferred income taxes of $(257) at
December 31, 2009 and $(438) at December 31, 2008 (417) (732)
Noncontrolling interest 50 44
Total shareholders’ equity 16,241 16,081
Total liabilities and shareholders’ equity $ 165,764 $ 152,015
Common shares outstanding 689,750 559,248
Common shares authorized 1,000,000 1,000,000
Preferred shares outstanding —3
Preferred shares authorized 5,000 5,000
The accompanying notes are an integral part of these consolidated financial statements.
89