BB&T 2009 Annual Report Download - page 90
Download and view the complete annual report
Please find page 90 of the 2009 BB&T annual report below. You can navigate through the pages in the report by either clicking on the pages listed below, or by using the keyword search tool below to find specific information within the annual report.-
 1
1 -
2
-
3
-
4
-
5
-
6
-
7
-
8
-
9
-
10
-
11
-
12
-
13
-
14
-
15
-
16
-
17
-
18
-
19
-
20
-
21
-
22
-
23
-
24
-
25
-
26
-
27
-
28
-
29
-
30
-
31
-
32
-
33
-
34
-
35
-
36
-
37
-
38
-
39
-
40
-
41
-
42
-
43
-
44
-
45
-
46
-
47
-
48
-
49
-
50
-
51
-
52
-
53
-
54
-
55
-
56
-
57
-
58
-
59
-
60
-
61
-
62
-
63
-
64
-
65
-
66
-
67
-
68
-
69
-
70
-
71
-
72
-
73
-
74
-
75
-
76
-
77
-
78
-
79
-
 80
80 -
 81
81 -
 82
82 -
 83
83 -
 84
84 -
 85
85 -
 86
86 -
 87
87 -
 88
88 -
 89
89 -
 90
90 -
 91
91 -
 92
92 -
 93
93 -
 94
94 -
 95
95 -
 96
96 -
 97
97 -
 98
98 -
 99
99 -
 100
100 -
101
-
102
-
103
-
104
-
105
-
106
-
107
-
108
-
109
-
110
-
111
-
112
-
113
-
114
-
115
-
116
-
117
-
118
-
119
-
120
-
121
-
122
-
123
-
124
-
125
-
126
-
127
-
128
-
129
-
130
-
131
-
132
-
133
-
134
-
135
-
136
-
137
-
138
-
139
-
140
-
141
-
142
-
143
-
144
-
145
-
146
-
147
-
148
-
149
-
150
-
151
-
152
-
153
-
154
-
155
-
156
-
157
-
158
-
159
-
160
-
161
-
162
-
163
-
164
-
165
-
166
-
167
-
168
-
169
-
170
 |
 |

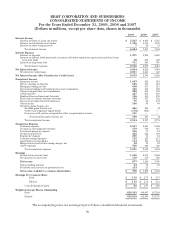
BB&T CORPORATION AND SUBSIDIARIES
CONSOLIDATED STATEMENTS OF INCOME
For the Years Ended December 31, 2009, 2008 and 2007
(Dollars in millions, except per share data, shares in thousands)
2009 2008 2007
Interest Income
Interest and fees on loans and leases $ 5,547 $ 6,003 $ 6,713
Interest and dividends on securities 1,330 1,176 1,130
Interest on other earning assets 728 51
Total interest income 6,884 7,207 7,894
Interest Expense
Interest on deposits 1,271 1,891 2,620
Interest on federal funds purchased, securities sold under repurchase agreements and short-term
borrowed funds 58 235 409
Interest on long-term debt 711 843 985
Total interest expense 2,040 2,969 4,014
Net Interest Income 4,844 4,238 3,880
Provision for credit losses 2,811 1,445 448
Net Interest Income After Provision for Credit Losses 2,033 2,793 3,432
Noninterest Income
Insurance income 1,047 928 853
Service charges on deposits 690 673 611
Mortgage banking income 658 275 115
Investment banking and brokerage fees and commissions 346 354 343
Other nondeposit fees and commissions 229 189 184
Checkcard fees 227 201 180
Bankcard fees and merchant discounts 156 151 139
Trust and investment advisory revenues 139 147 162
Income from bank-owned life insurance 97 84 101
Other income 146 88 89
Securities gains (losses), net
Realized gains (losses), net 240 211 (3)
Other-than-temporary impairments (172) (104) —
Less non-credit portion recognized in other comprehensive income 131 ——
Total securities gains (losses), net 199 107 (3)
Total noninterest income 3,934 3,197 2,774
Noninterest Expense
Personnel expense 2,517 2,201 2,094
Occupancy and equipment expense 579 509 477
Foreclosed property expense 356 79 31
Professional services 262 204 139
Regulatory charges 230 30 14
Loan processing expenses 135 125 111
Amortization of intangibles 114 100 104
Merger-related and restructuring charges, net 38 15 21
Other expenses 700 648 633
Total noninterest expense 4,931 3,911 3,624
Earnings
Income before income taxes 1,036 2,079 2,582
Provision for income taxes 159 550 836
Net income 877 1,529 1,746
Noncontrolling interest 24 10 12
Dividends and accretion on preferred stock 124 21 —
Net income available to common shareholders $ 729 $ 1,498 $ 1,734
Earnings Per Common Share
Basic $ 1.16 $ 2.73 $ 3.17
Diluted $ 1.15 $ 2.71 $ 3.14
Cash dividends declared $ .92 $ 1.87 $ 1.80
Weighted Average Shares Outstanding
Basic 629,583 548,847 547,184
Diluted 635,619 552,498 551,755
The accompanying notes are an integral part of these consolidated financial statements.
90